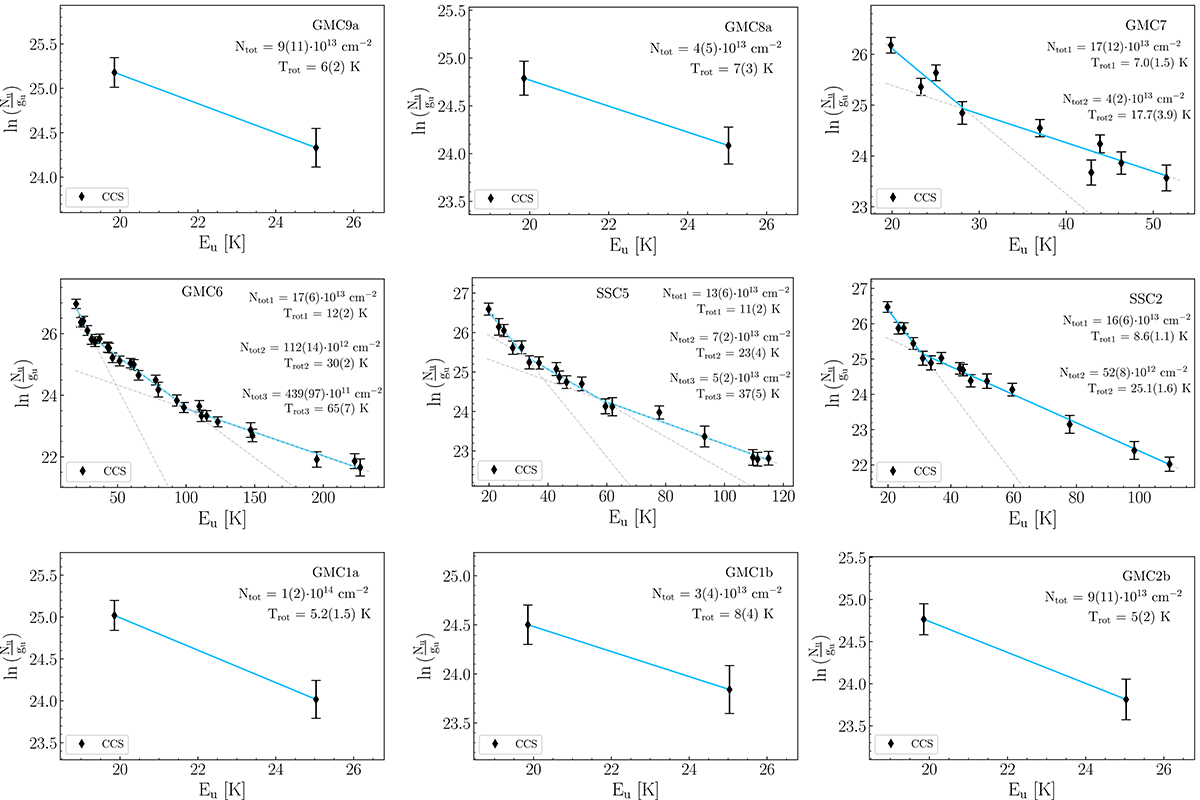
Fig. 6.
Download original image
Rotation diagrams of CCS. The parameters Nu, gu, and Eu are the column density, degeneracy and level energy (with respect to the ground state level) of the upper level, respectively. The error bars on ln(Nu/gu) include the 15% calibration error. The blue line represent the best fits and the dashed grey lines are the extrapolations of the fit for the full range of Eu.
Current usage metrics show cumulative count of Article Views (full-text article views including HTML views, PDF and ePub downloads, according to the available data) and Abstracts Views on Vision4Press platform.
Data correspond to usage on the plateform after 2015. The current usage metrics is available 48-96 hours after online publication and is updated daily on week days.
Initial download of the metrics may take a while.