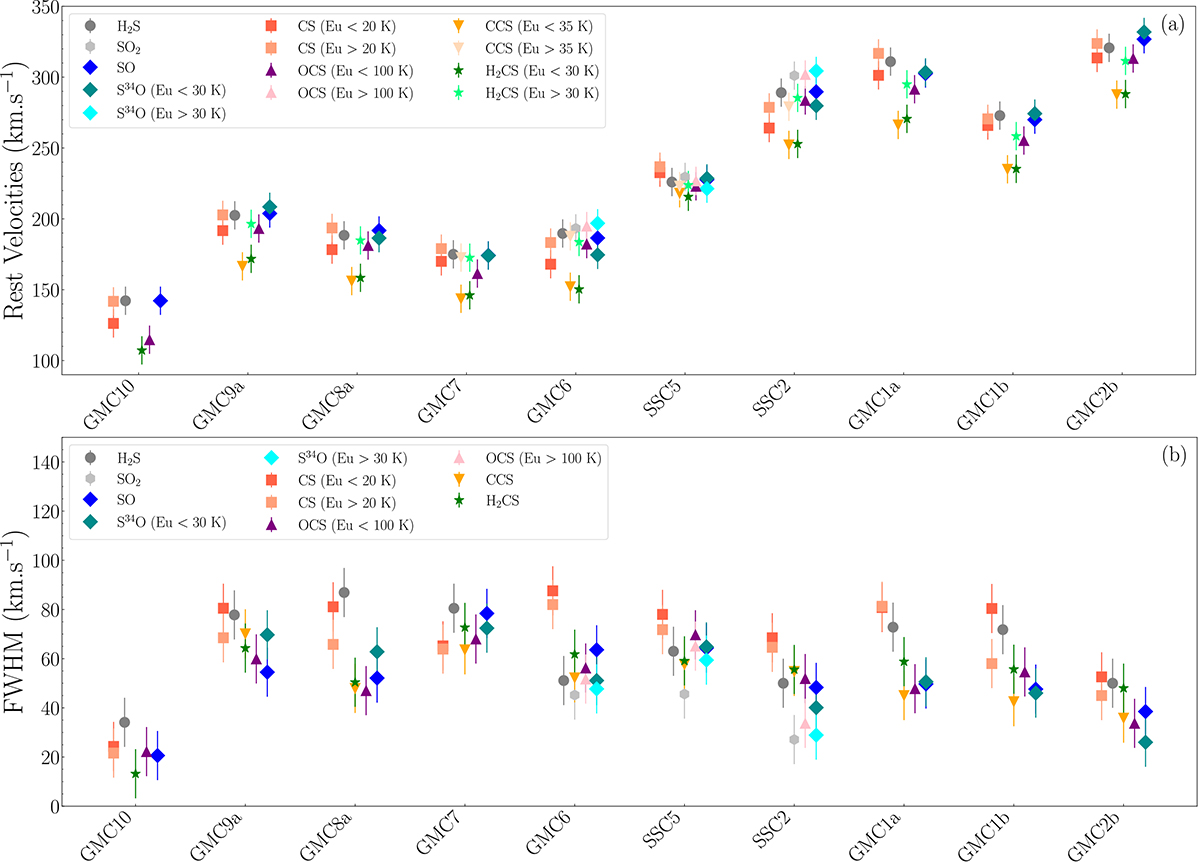
Fig. 4.
Download original image
Results of Gaussian fits. The listed sequence of clouds follows the layout of the GMCs of the CMZ as shown in Figs. 1–3. (a) Systemic velocities for each species as a function of the regions. If a strong difference is seen in the low- and high upper-level energy transitions of the species, the two velocity components are shown. (b) FWHM for each species as a function of the regions. If, for one species, a difference in line width is seen between the low- and high upper-level energy transitions, the two components are shown.
Current usage metrics show cumulative count of Article Views (full-text article views including HTML views, PDF and ePub downloads, according to the available data) and Abstracts Views on Vision4Press platform.
Data correspond to usage on the plateform after 2015. The current usage metrics is available 48-96 hours after online publication and is updated daily on week days.
Initial download of the metrics may take a while.