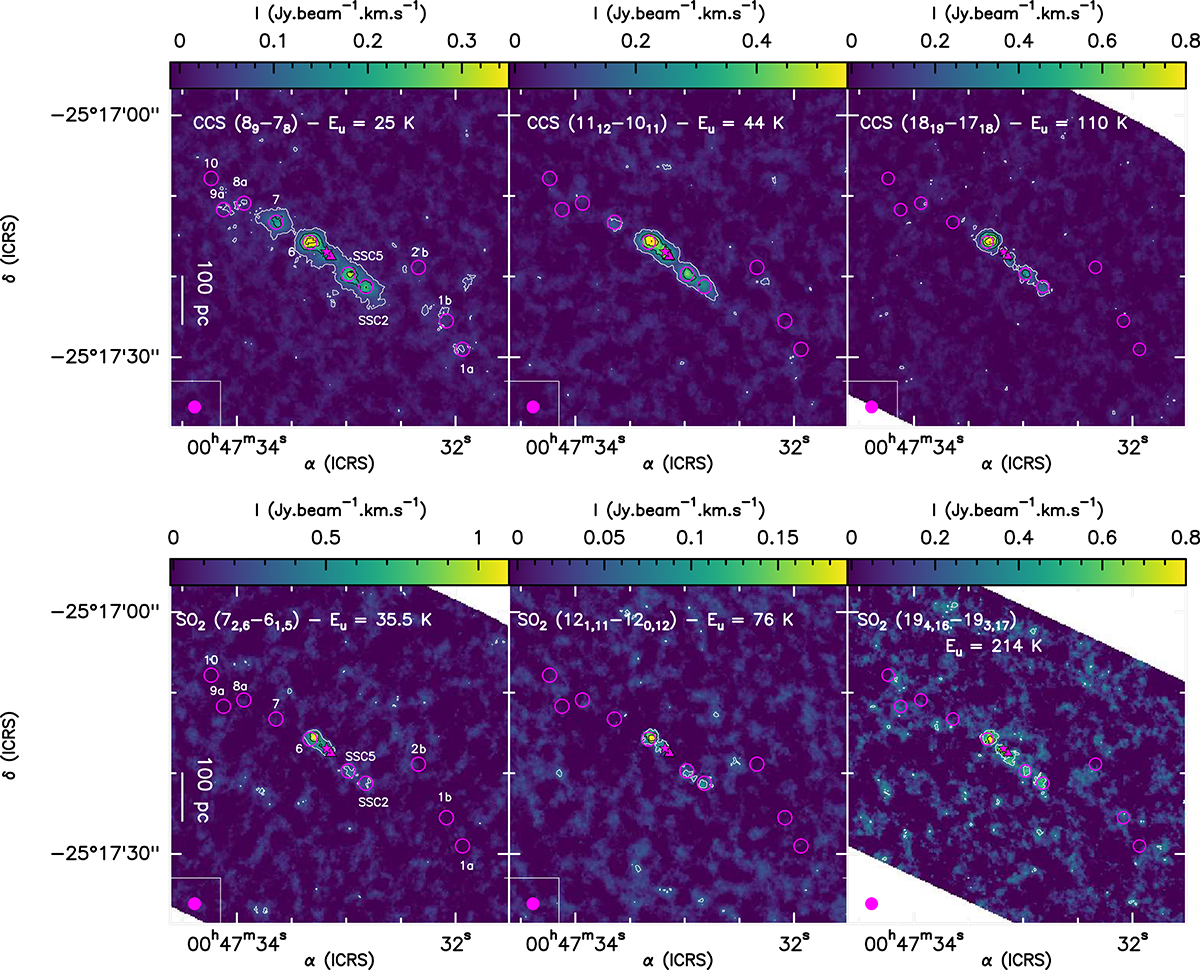
Fig. 3.
Download original image
Same as Fig. 1 but for CCS and SO2, which are mostly detected towards the inner part of the CMZ. Top: velocity-integrated maps of CCS (89 − 78), (1112 − 1011), and (1819 − 1718). Levels start at 3σ (1σ = 15.7, 30, and 33 mJy beam−1, respectively; white contours) with steps of 7σ (black contours). Bottom: velocity-integrated maps of SO2 (72, 6 − 61, 5), (121, 11 − 120, 12) and (194, 16 − 193, 17), from left to right. Levels start at 3σ (1σ = 18.4, 91.5 and 125 mJy beam−1, respectively; white contours) with steps of 5, 3, and 3σ (black contours), respectively.
Current usage metrics show cumulative count of Article Views (full-text article views including HTML views, PDF and ePub downloads, according to the available data) and Abstracts Views on Vision4Press platform.
Data correspond to usage on the plateform after 2015. The current usage metrics is available 48-96 hours after online publication and is updated daily on week days.
Initial download of the metrics may take a while.