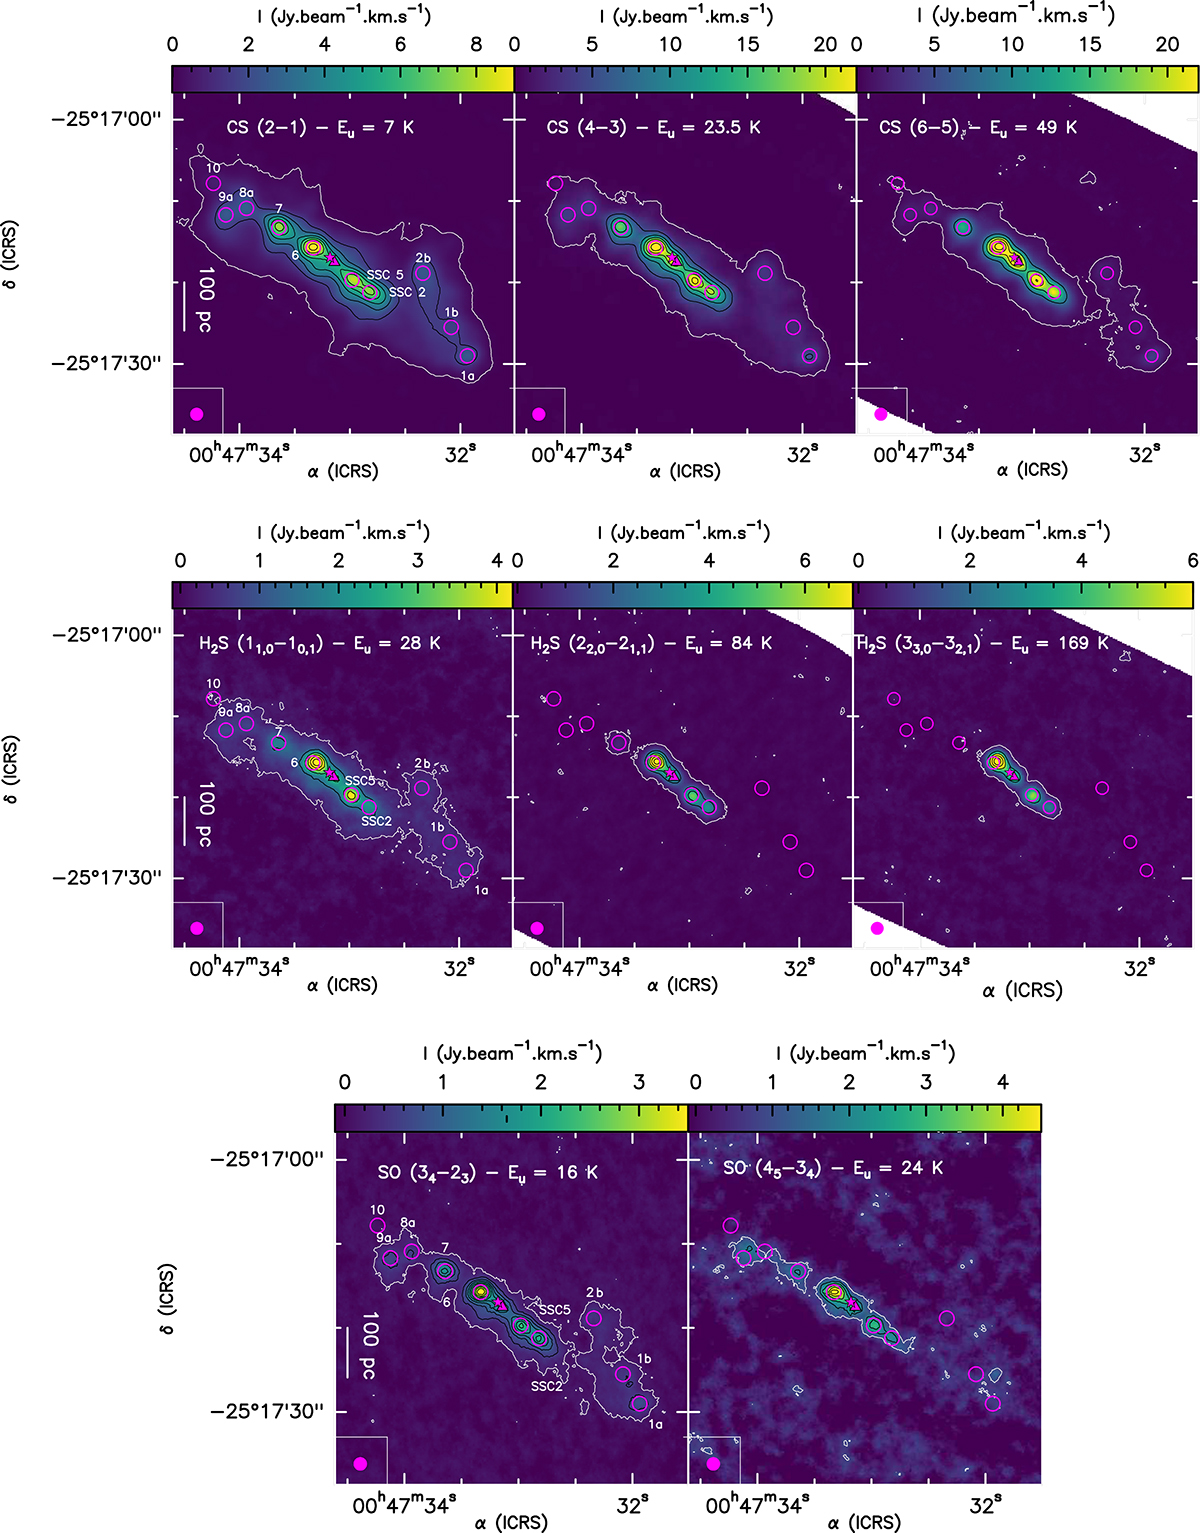
Fig. 1.
Download original image
Velocity-integrated maps of CS, H2S, and SO, which show extended emission throughout the CMZ with their peak of intensity towards the inner CMZ. The positions of TH2 (Turner & Ho 1985) and the kinematic centre (Müller-Sánchez et al. 2010) are labelled by a filled magenta star and triangle, respectively. The regions where the spectra were extracted are shown by the magenta circles and are labelled in the left-most panel. The beam is depicted in the lower left corner of each plot. The scale bar of 100 pc corresponds to ∼6″. Top: velocity-integrated maps of CS (2–1), (4–3) and (6–5). Levels start at 3σ (1σ = 46, 150, and 148 mJy.beam−1, respectively; white contours) with steps of 30, 30, and 50σ (black contours), respectively. Middle: velocity-integrated maps of H2S (11, 0 − 10, 1), (22, 0 − 21, 1) and (33, 0 − 32, 1). Levels start at 3σ (1σ = 79, 50, and 81 mJy beam−1, respectively; white contours) with steps of 15, 40, and 30σ (black contours), respectively. Bottom: velocity-integrated maps of SO (34 − 23) and (35 − 34). Levels start at 3σ (1σ = 50 and 28 mJy.beam−1, respectively; white contours) with steps of 7 and 3σ (black contours), respectively.
Current usage metrics show cumulative count of Article Views (full-text article views including HTML views, PDF and ePub downloads, according to the available data) and Abstracts Views on Vision4Press platform.
Data correspond to usage on the plateform after 2015. The current usage metrics is available 48-96 hours after online publication and is updated daily on week days.
Initial download of the metrics may take a while.