Fig. A1
Download original image
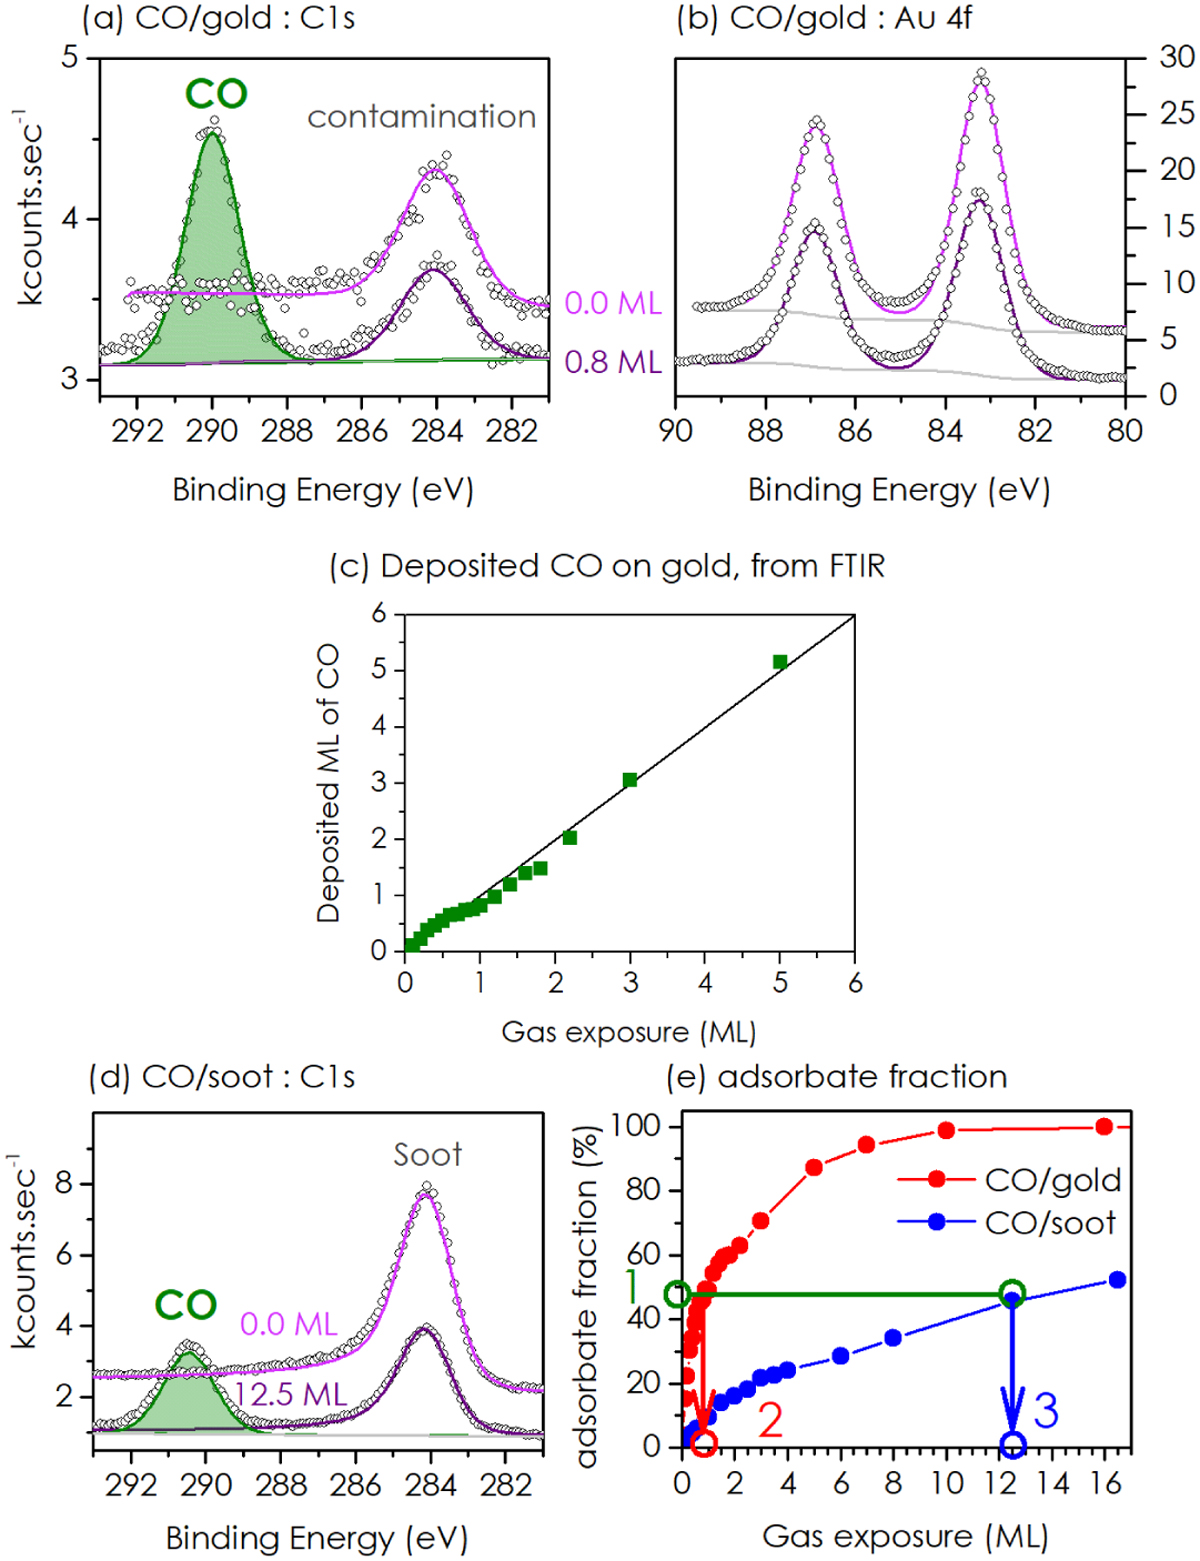
Data analysis. (a) XPS C1s and (b) XPS Au 4f data for CO adsorbed on gold at 10 K, at 0.0 ML and 0.8 ML of CO exposure. (c) Number of CO layers deposited on gold as a function of CO exposure, deduced from the infrared strength of the stretching CO band at 2142 cm−1. IR intensities follow the diagonal line when SC=1. (d) C1s XPS data for CO adsorbed on soot at 10 K, at 0.0 ML and 12.5 ML of CO exposure. (e) CO coverage per unit surface area (in percent) deduced from the XPS signals (see the main text) as function of the CO exposure. The graphical method for determining the SC of CO on soot consists in dividing the exposure on gold (point 2) by the exposure on soot (point 3) necessary to obtain the same coverage (point 1; see the main text).
Current usage metrics show cumulative count of Article Views (full-text article views including HTML views, PDF and ePub downloads, according to the available data) and Abstracts Views on Vision4Press platform.
Data correspond to usage on the plateform after 2015. The current usage metrics is available 48-96 hours after online publication and is updated daily on week days.
Initial download of the metrics may take a while.