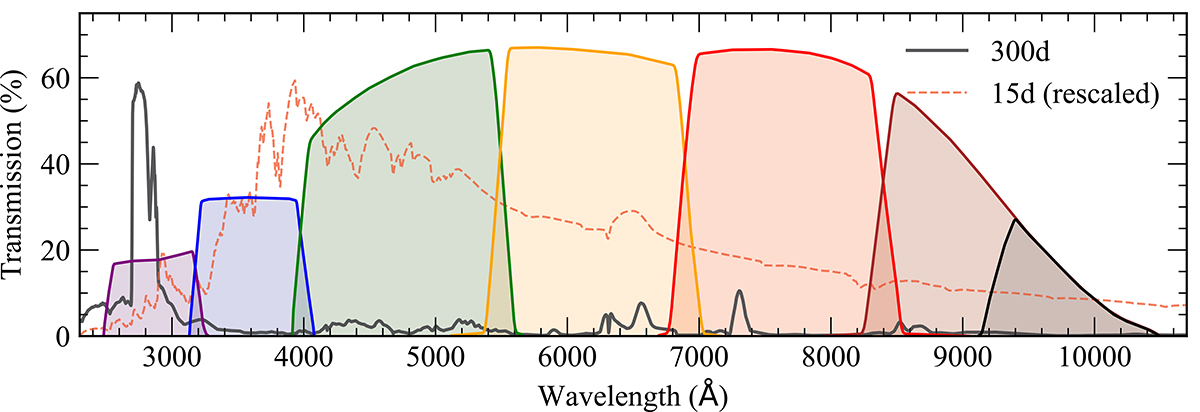
Fig. 1.
Download original image
Normalized spectra of model Pwr1e41 from Dessart & Hillier (2022) plotted over the filter transmission function of the CSST sky survey. The purple line and shaded region under it denotes the transmission function of NUV band. The red dashed line is the SN spectrum 15 days after explosion (re-scaled by an factor of 0.3), when most of power is released in optical range. The solid black line is the model spectrum at 300 days after explosion, when reprocessed shock power dominates the UV luminosity in the form of Lyα (falling in the FUV and thus not shown) and the Mg IIλλ 2795, 2802 doublet in NUV band. The other shaded regions are transmission functions of u/g/r/i/z/Y bands.
Current usage metrics show cumulative count of Article Views (full-text article views including HTML views, PDF and ePub downloads, according to the available data) and Abstracts Views on Vision4Press platform.
Data correspond to usage on the plateform after 2015. The current usage metrics is available 48-96 hours after online publication and is updated daily on week days.
Initial download of the metrics may take a while.