Fig. 7
Download original image
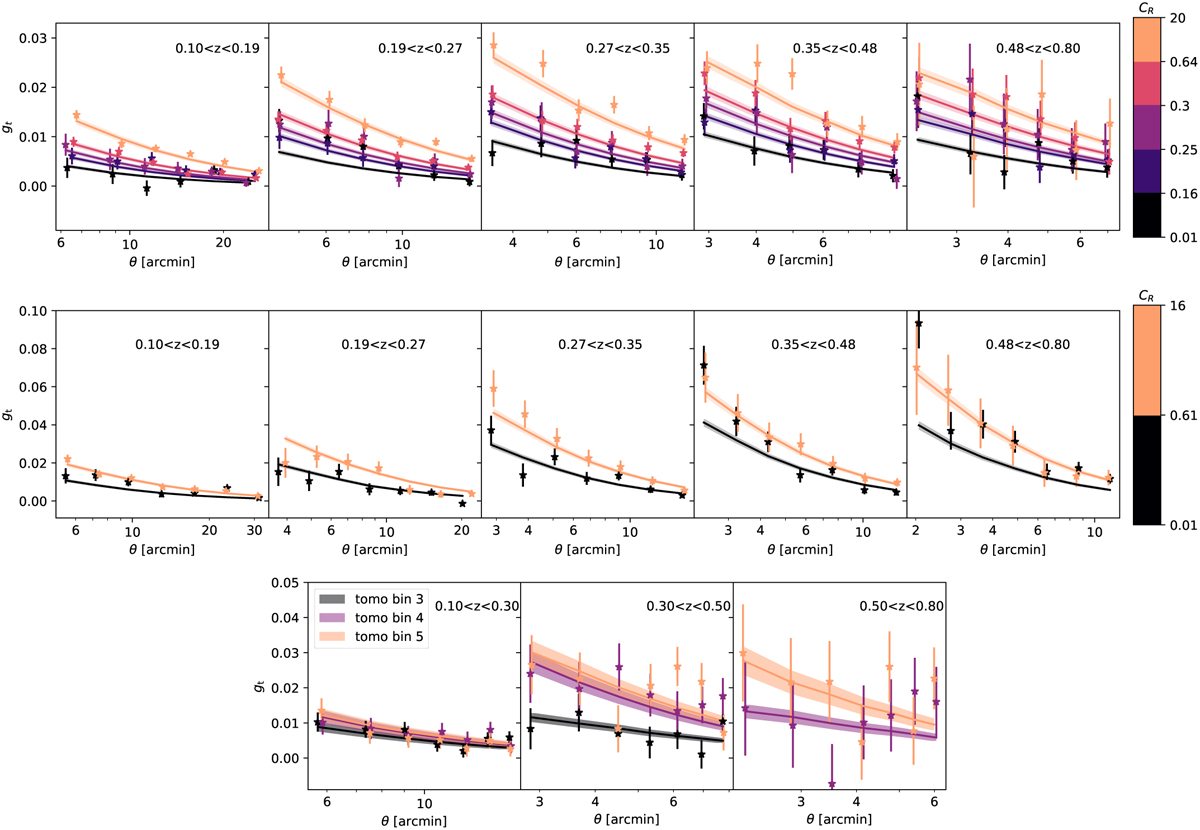
Goodness of fit for the three WL surveys, DES (top panel), HSC (middle panel), and KiDS (bottom panel). Each panel shows a stacked observed profile in the count rate and redshift bin (stars), compared with the best-fitting weak lensing shear profiles according to mass calibration, i.e., the weak lensing masses based on the count rates of the clusters and calibrated scaling relations. The color bar indicates the count rate binning applied to DES and HSC, while tomographic bins for KiDS. For a more extensive description of the weak lensing goodness of fit, see Grandis et al. (2024), and Kleinebreil et al. (2024).
Current usage metrics show cumulative count of Article Views (full-text article views including HTML views, PDF and ePub downloads, according to the available data) and Abstracts Views on Vision4Press platform.
Data correspond to usage on the plateform after 2015. The current usage metrics is available 48-96 hours after online publication and is updated daily on week days.
Initial download of the metrics may take a while.