Open Access
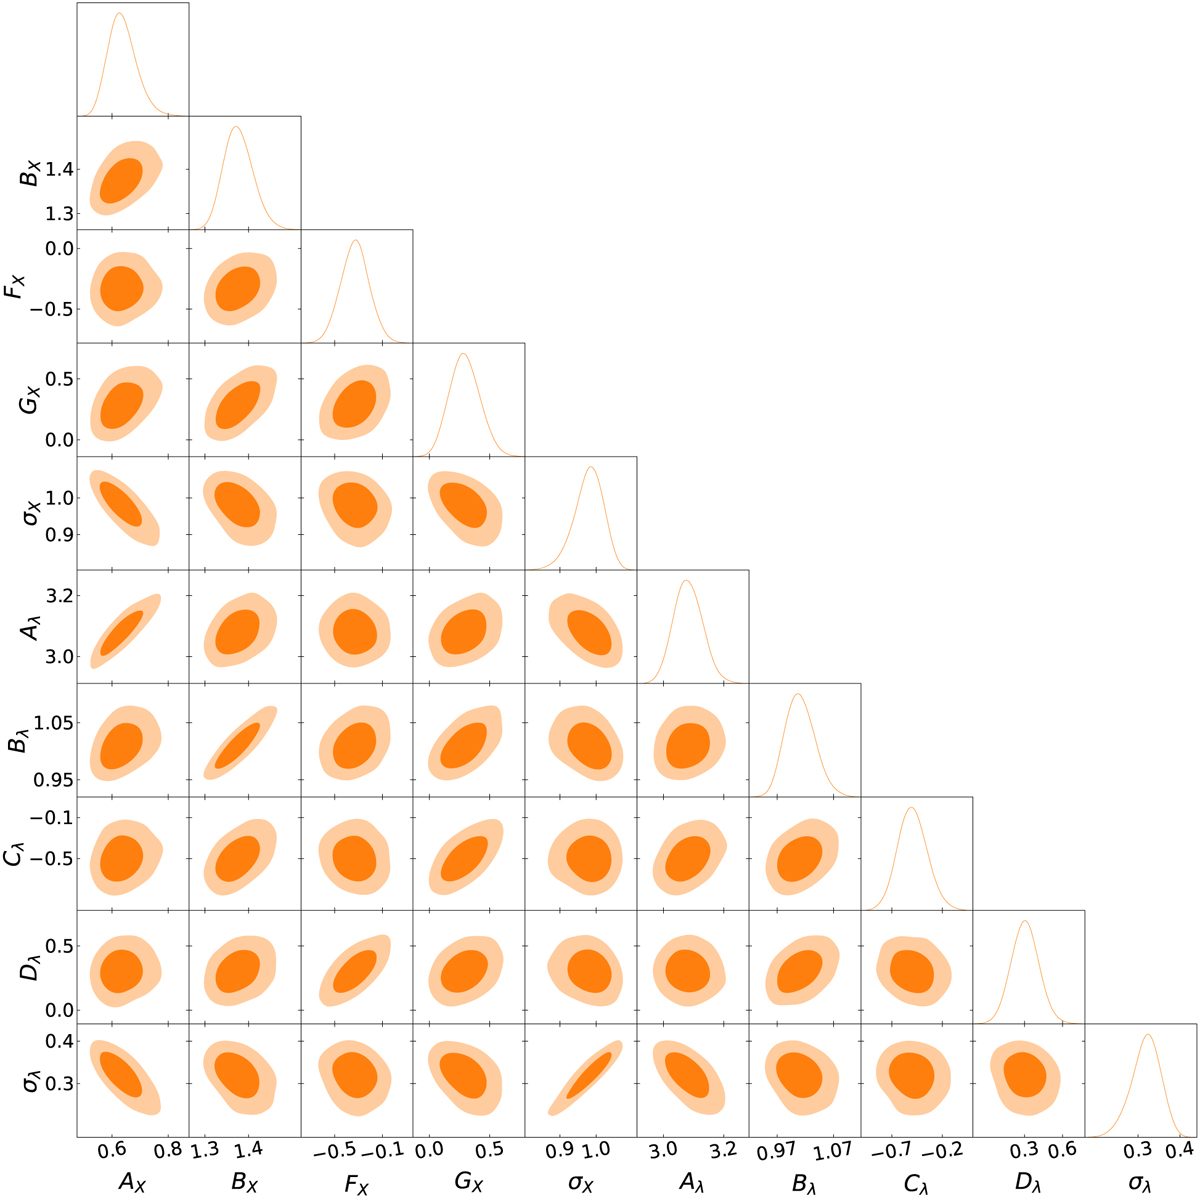
Fig. 5
Download original image
Posteriors on the CR − M and λ − M scaling relation parameters. A strong correlation between X-ray and optical scaling relation is visible on the corner plots. The best-fit values and their uncertainties are provided in Table 2. The solid and shaded orange contour represents the 68 and 95% contour levels respectively.
Current usage metrics show cumulative count of Article Views (full-text article views including HTML views, PDF and ePub downloads, according to the available data) and Abstracts Views on Vision4Press platform.
Data correspond to usage on the plateform after 2015. The current usage metrics is available 48-96 hours after online publication and is updated daily on week days.
Initial download of the metrics may take a while.