Fig. 3
Download original image
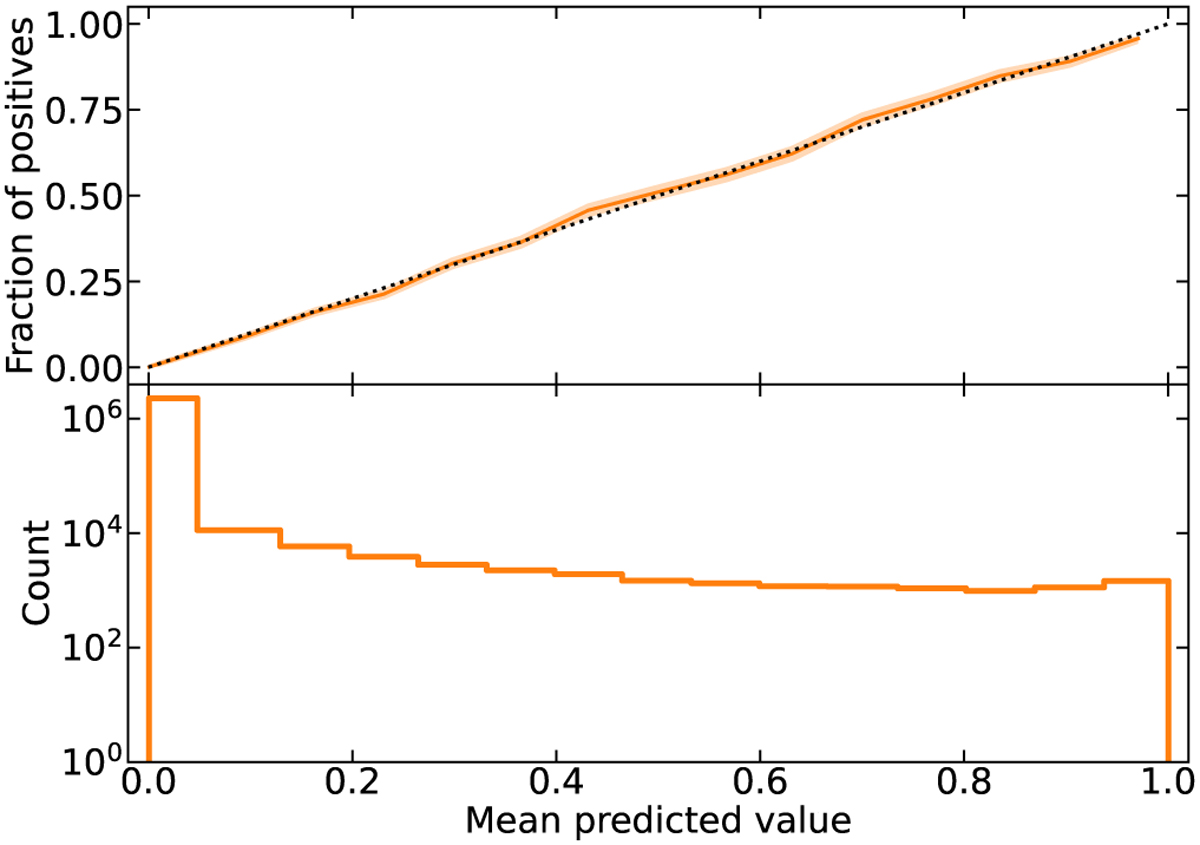
Reliability of the selection function model, as estimated from a test sample comprising 2566 057 simulated galaxy clusters, none are used in the training phase. The x-axis represents the detection probability predicted by the selection function model. Top panel: y-axis representing the fraction of detected objects among all simulated objects in each bin. The shaded area corresponds to the 1σ binomial uncertainty. The dotted line represents the 1:1 relation. Bottom panel: histogram of clusters in the test sample per bin of predicted detection probability.
Current usage metrics show cumulative count of Article Views (full-text article views including HTML views, PDF and ePub downloads, according to the available data) and Abstracts Views on Vision4Press platform.
Data correspond to usage on the plateform after 2015. The current usage metrics is available 48-96 hours after online publication and is updated daily on week days.
Initial download of the metrics may take a while.