Fig. D.1
Download original image
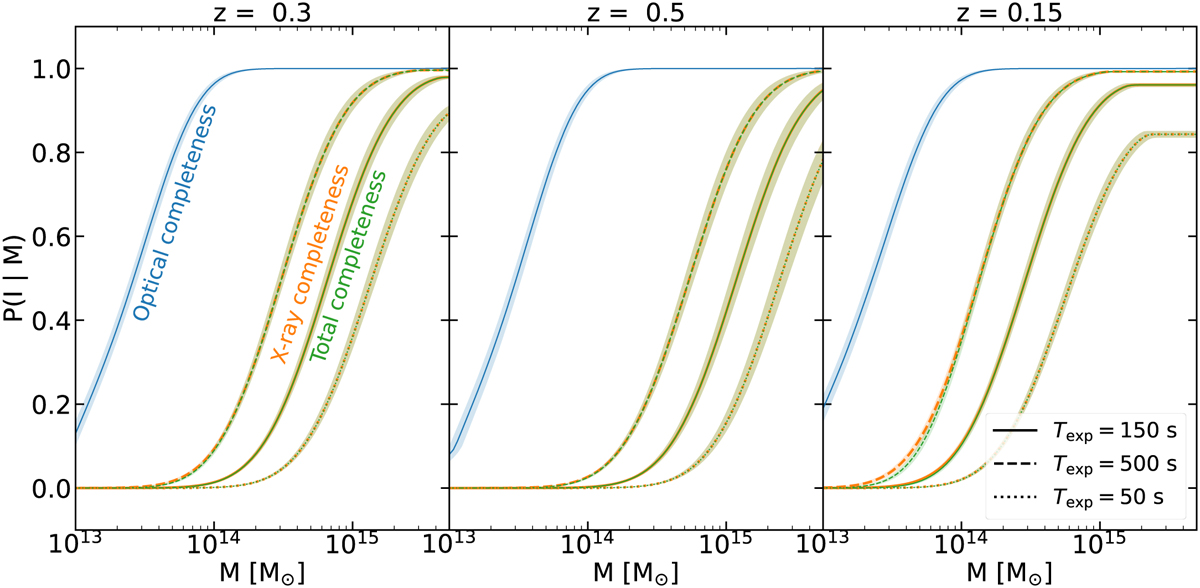
Optical (blue), X-ray (orange), and total (green) completeness computed as a function of mass from the best-fit values. The three panels show different redshift, 0.3, 0.5, and 0.15, and in each panel, a solid line corresponds to a exposure of 150 s, dashed to 500 s, and dotted to 50 s. The shaded area around each line represent the 1σ uncertainty from resampling the best fitting chain 1000 times.
Current usage metrics show cumulative count of Article Views (full-text article views including HTML views, PDF and ePub downloads, according to the available data) and Abstracts Views on Vision4Press platform.
Data correspond to usage on the plateform after 2015. The current usage metrics is available 48-96 hours after online publication and is updated daily on week days.
Initial download of the metrics may take a while.