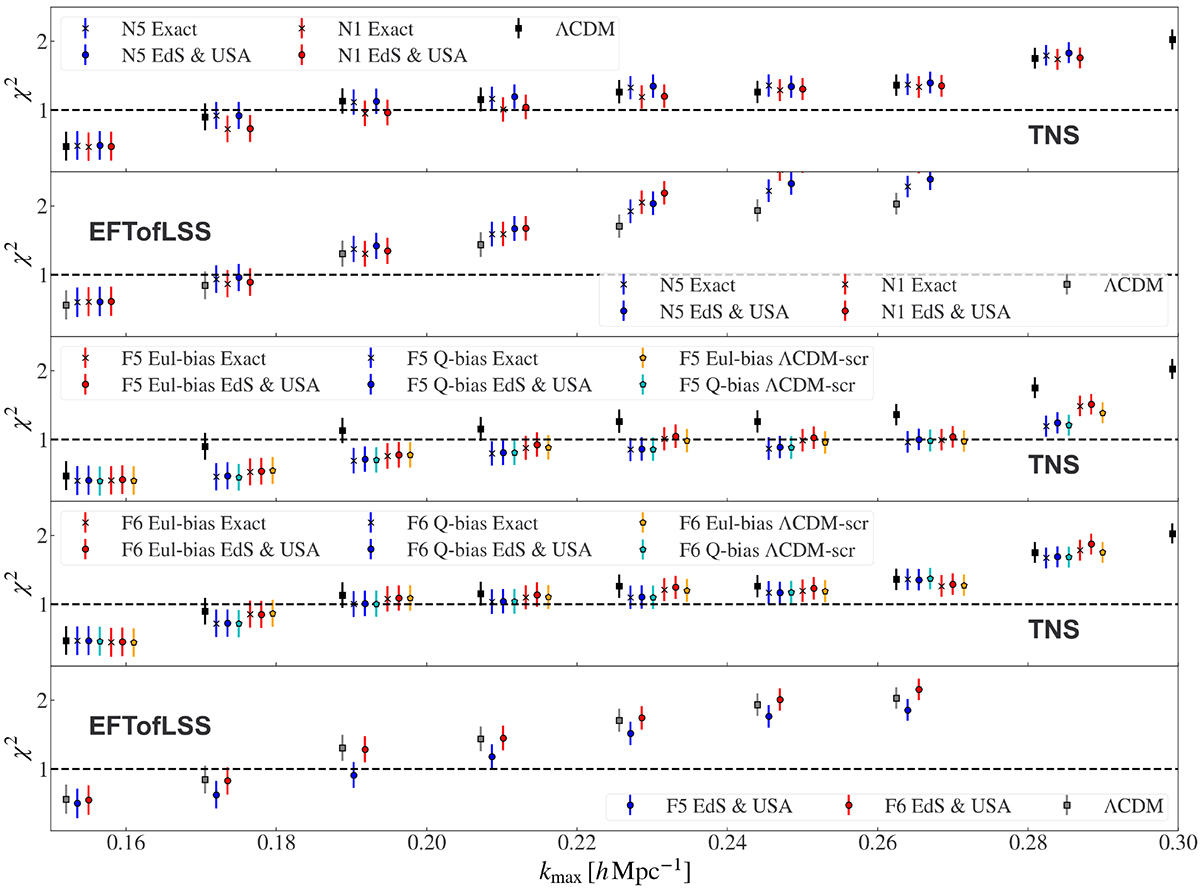
Fig. 4.
Download original image
Reduced χ2 for the fit of the redshift space halo power spectrum multipoles, computed with the TNS and the EFTofLSS prescriptions, to the measured multipoles from the DGP and f(R) ELEPHANT simulations, as a function of kmax and at redshift z = 1. From top to bottom, TNS fit to DGP, EFTofLSS fit to DGP, TNS fit to f(R) with |fR0| = 10−5, TNS fit to f(R) with |fR0| = 10−6, and EFTofLSS fit to f(R). Crosses, circles and pentagons indicate the exact computation, the EdS and USA approximation and the ΛCDM-scr approximation, respectively. The ΛCDM cases are shown as black (TNS) and grey (EFTofLSS) squares. The error bars are the 1σ errors on the χ2 statistic with Ndof = 2Nk − Nx degrees of freedom, where Nk are the number of wave modes used in calculating χ2. We use Nx = 4 for the TNS model using Eulerian bias and Nx = 5 for EFTofLSS and the TNS model with Q-bias. All EFTofLSS exact and f(R) calculations are performed using PyBird, while the DGP EdS and USA calculations are performed using PBJ. The ΛCDM predictions are made using the exact kernel calculations.
Current usage metrics show cumulative count of Article Views (full-text article views including HTML views, PDF and ePub downloads, according to the available data) and Abstracts Views on Vision4Press platform.
Data correspond to usage on the plateform after 2015. The current usage metrics is available 48-96 hours after online publication and is updated daily on week days.
Initial download of the metrics may take a while.