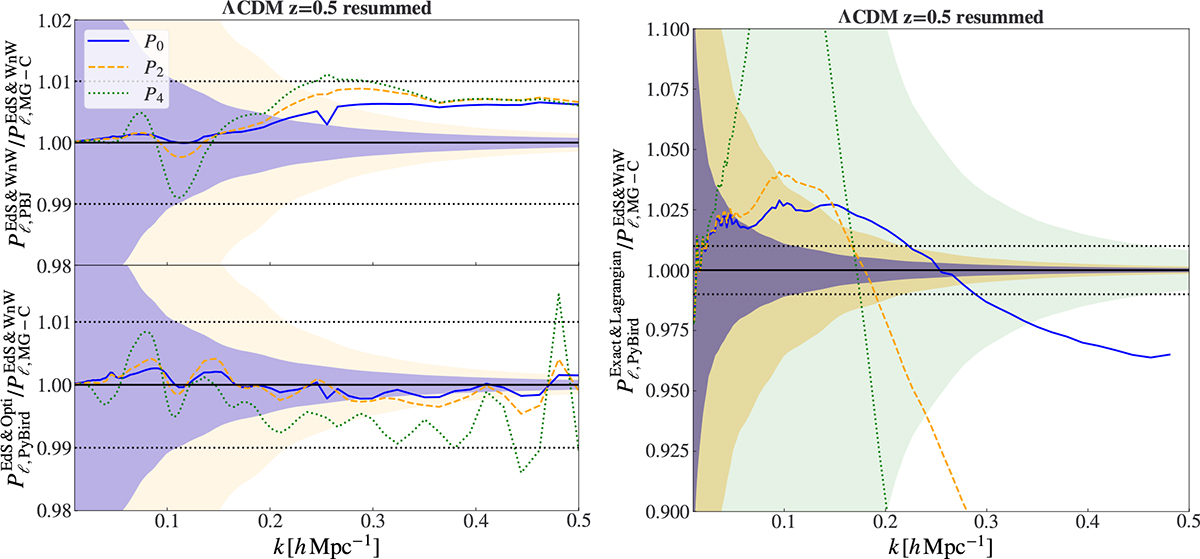
Fig. C.2.
Download original image
The ratio of the SPT 1-loop monopole (blue solid), quadrupole (orange dashed) and hexadecapole (green dotted) between different codes for ΛCDM at z = 0.5. The MG-Copter prediction is taken as the reference in all plots. The left panels show the ratios using the WnW or OPTIRESUM resummation. The top left panel shows the PBJ prediction and the bottom panel the Pybird prediction, both predictions being computed using the EdS approximation. The right panel shows the same as the bottom left plot but now with Pybird applying the full Lagrangian resummation method. Blue and beige bands indicate errors on the monopole and quadrupole assuming a ΛCDM Gaussian covariance with V = 8.8 h−3 Gpc3 and no shot noise contribution. We note that the hexadecapole error fills the left plot and so we have omitted it but include it in the right hand plot as a green band.
Current usage metrics show cumulative count of Article Views (full-text article views including HTML views, PDF and ePub downloads, according to the available data) and Abstracts Views on Vision4Press platform.
Data correspond to usage on the plateform after 2015. The current usage metrics is available 48-96 hours after online publication and is updated daily on week days.
Initial download of the metrics may take a while.