Fig. 5.
Download original image
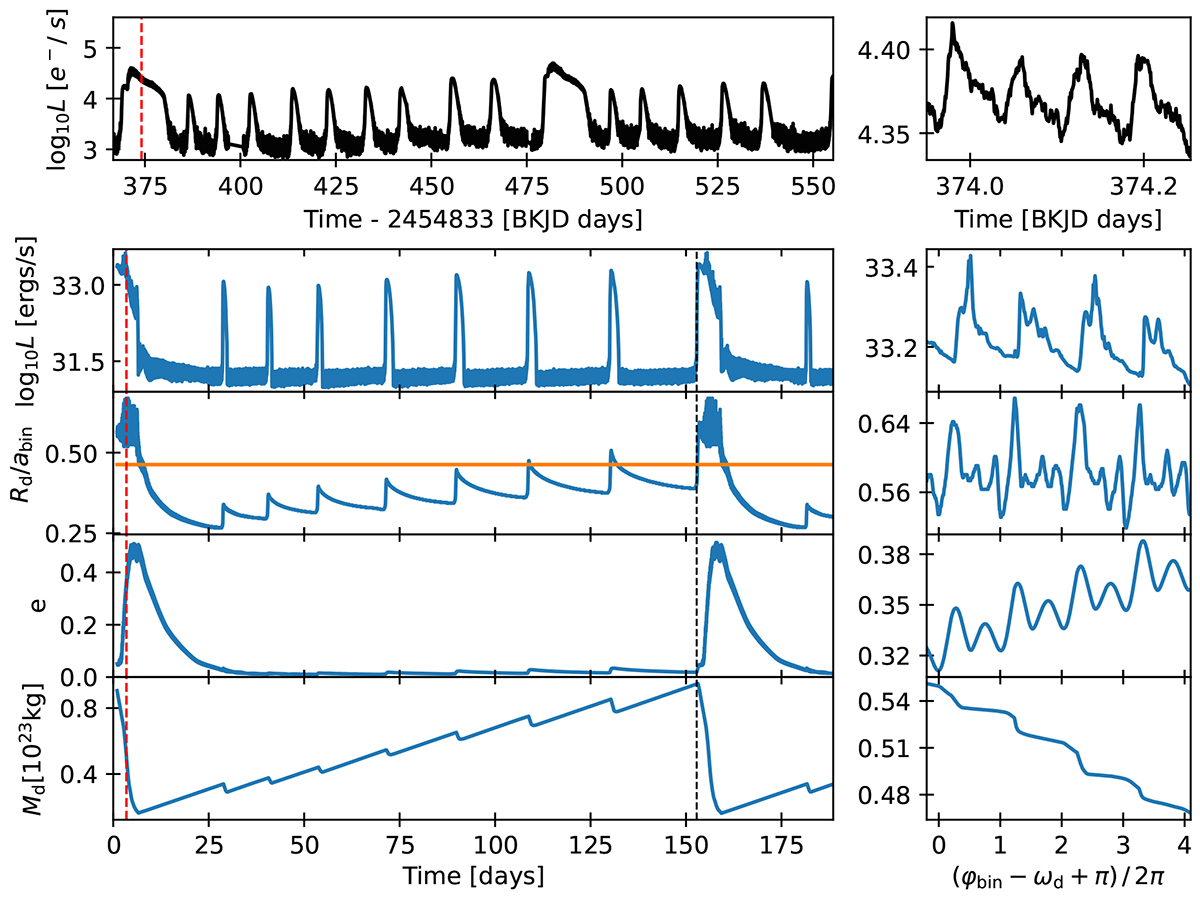
The upper panels show Kepler data of V1504 Cygni over an equal length time frame as the simulated data below. The binary period is 1.7 hours, and one day is equal to 14.1 binary periods. The extent of the y-axis in the left panel is the same as in the plot below, but in the right panel, the extent of the y-axis is reduced by a factor of 3.8 compared to the plot below. Bottom left panel: Luminosity, disk radius, eccentricity, and total mass as a function of time for the fiducial model. The orange line indicates the 3:1 orbital resonance radius. The red dashed line indicates the time at which the right panel is zoomed in and the black dashed line indicates the start of the second superoutburst. Bottom right panel: Zoom in on the same quantities during a superoutburst as a function of the longitude of pericenter of the disk relative to the position of the binary. The angles are shifted by π and normalized so that integer values indicate that the binary passes the bulge of the eccentric disk.
Current usage metrics show cumulative count of Article Views (full-text article views including HTML views, PDF and ePub downloads, according to the available data) and Abstracts Views on Vision4Press platform.
Data correspond to usage on the plateform after 2015. The current usage metrics is available 48-96 hours after online publication and is updated daily on week days.
Initial download of the metrics may take a while.