Open Access
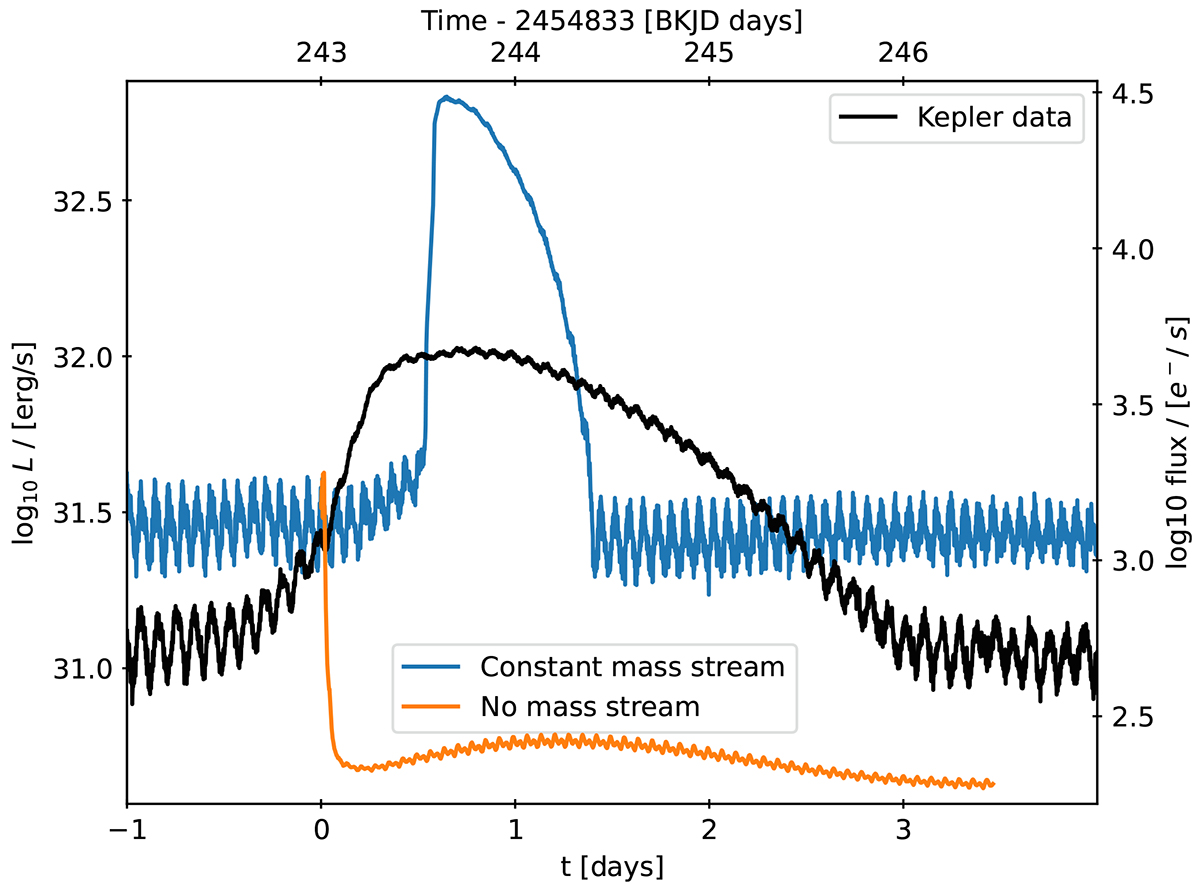
Fig. 18.
Download original image
Luminosities during the first normal outburst following a superoutburst. The black line presents Kepler data of V344 Lyr, the blue line is for our Ṁtr = 2.5 · 10−10 M⊙/yr model and the orange is a simulation of the same model but restarted with the mass transfer turned off.
Current usage metrics show cumulative count of Article Views (full-text article views including HTML views, PDF and ePub downloads, according to the available data) and Abstracts Views on Vision4Press platform.
Data correspond to usage on the plateform after 2015. The current usage metrics is available 48-96 hours after online publication and is updated daily on week days.
Initial download of the metrics may take a while.