Fig. 12.
Download original image
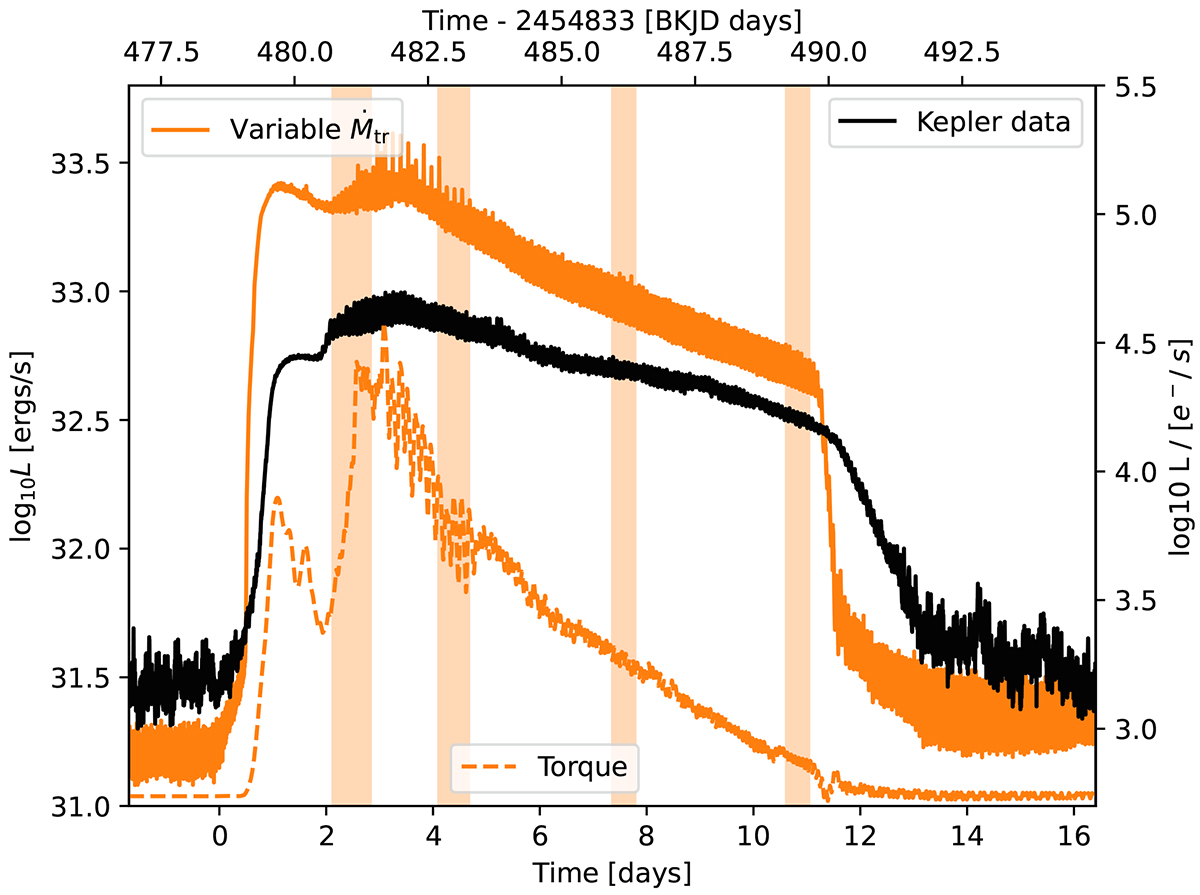
Luminosity evolution during a superoutburst for our variable mass transfer model (orange line, same as in Fig. 11) and Kepler data of V1504 Cygni (black line). The shaded regions indicate the time frames presented in Fig. 14. The orange dashed line is the torque exerted by the disk on the donor star. No units are given for the torque because we are only making a qualitative assessment.
Current usage metrics show cumulative count of Article Views (full-text article views including HTML views, PDF and ePub downloads, according to the available data) and Abstracts Views on Vision4Press platform.
Data correspond to usage on the plateform after 2015. The current usage metrics is available 48-96 hours after online publication and is updated daily on week days.
Initial download of the metrics may take a while.