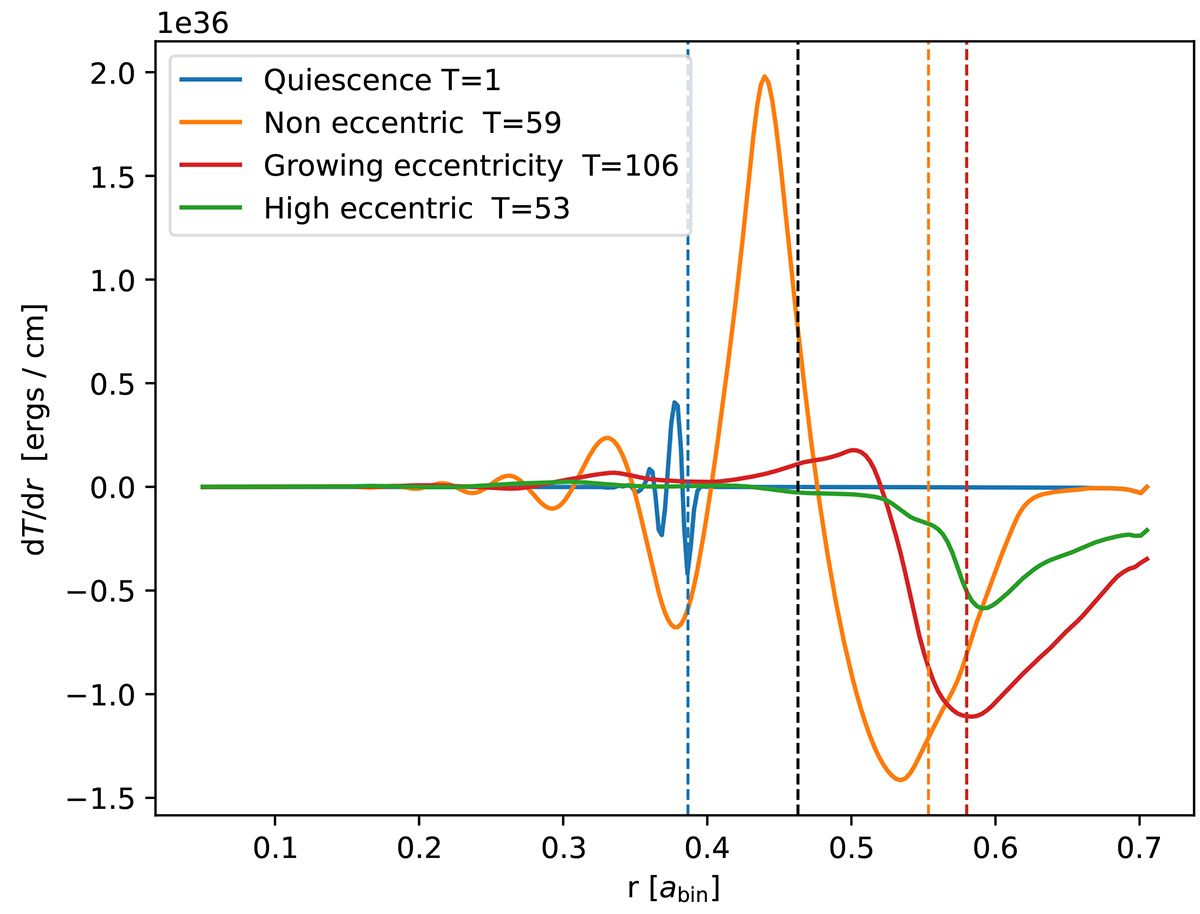
Fig. 10.
Download original image
Azimuthal and time-averaged (over 10 Pbin) gravitational torque density Eq. (16) during different stages of a superoutburst. The vertical dashed lines are the time-averaged disk radii during the same time frame. The black vertical line indicates the position of the 3:1 resonance. The legend also notes the total integrated torques exerted on the disk, normalized to the torque during quiescence.
Current usage metrics show cumulative count of Article Views (full-text article views including HTML views, PDF and ePub downloads, according to the available data) and Abstracts Views on Vision4Press platform.
Data correspond to usage on the plateform after 2015. The current usage metrics is available 48-96 hours after online publication and is updated daily on week days.
Initial download of the metrics may take a while.