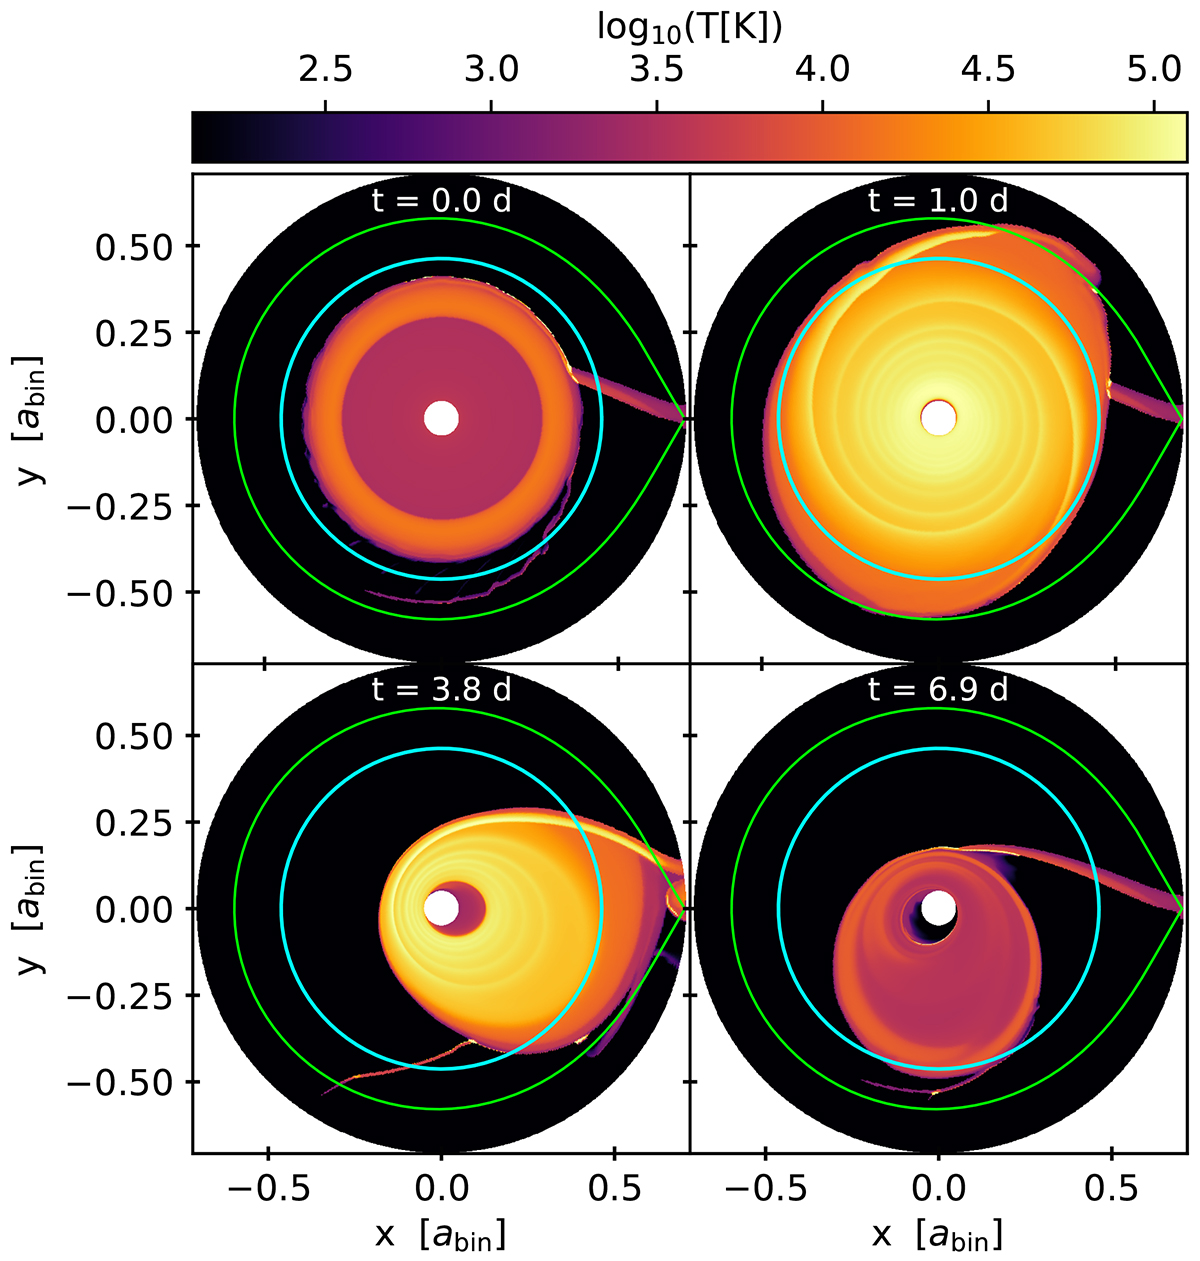
Fig. 1.
Download original image
Two-dimensional snapshots of the mid-plane temperature before and during a superoutburst for our fiducial setup, whose parameters are listed in Table 1. The cyan circle indicates the 3:1 resonance and the green line indicates the Roche lobe. The time in days is measured from the beginning of the outburst and one day is equal to 14.1 binary orbits (1.7 h). The simulation ran in a corotating reference frame, with the donor star fixed on the right side.
Current usage metrics show cumulative count of Article Views (full-text article views including HTML views, PDF and ePub downloads, according to the available data) and Abstracts Views on Vision4Press platform.
Data correspond to usage on the plateform after 2015. The current usage metrics is available 48-96 hours after online publication and is updated daily on week days.
Initial download of the metrics may take a while.