Fig. 8.
Download original image
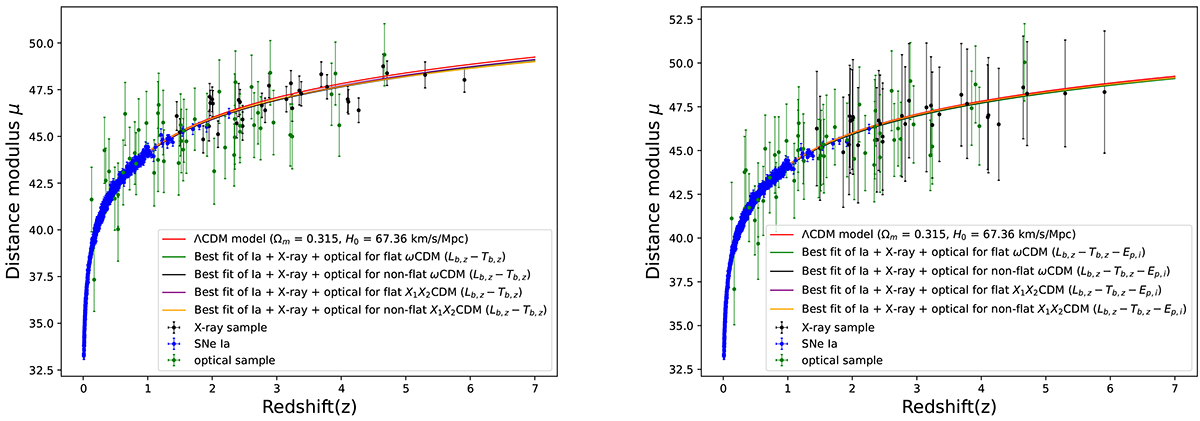
Calibrated GRB Hubble diagram at high redshift using the Lb, z − Tb, z correlation (left-hand panel) and the Lb, z − Tb, z − Ep, i correlation (right-hand panel) with SNe Ia, X-ray, and optical samples. The black and green points represent X-ray and optical samples, respectively. Blue points are SNe Ia from the Pantheon sample. The solid red line corresponds to the theoretical distance modulus calculated for a flat ΛCDM model with H0 = 67.36 km s−1 Mpc−1 and Ωm = 0.315.
Current usage metrics show cumulative count of Article Views (full-text article views including HTML views, PDF and ePub downloads, according to the available data) and Abstracts Views on Vision4Press platform.
Data correspond to usage on the plateform after 2015. The current usage metrics is available 48-96 hours after online publication and is updated daily on week days.
Initial download of the metrics may take a while.