Fig. 3.
Download original image
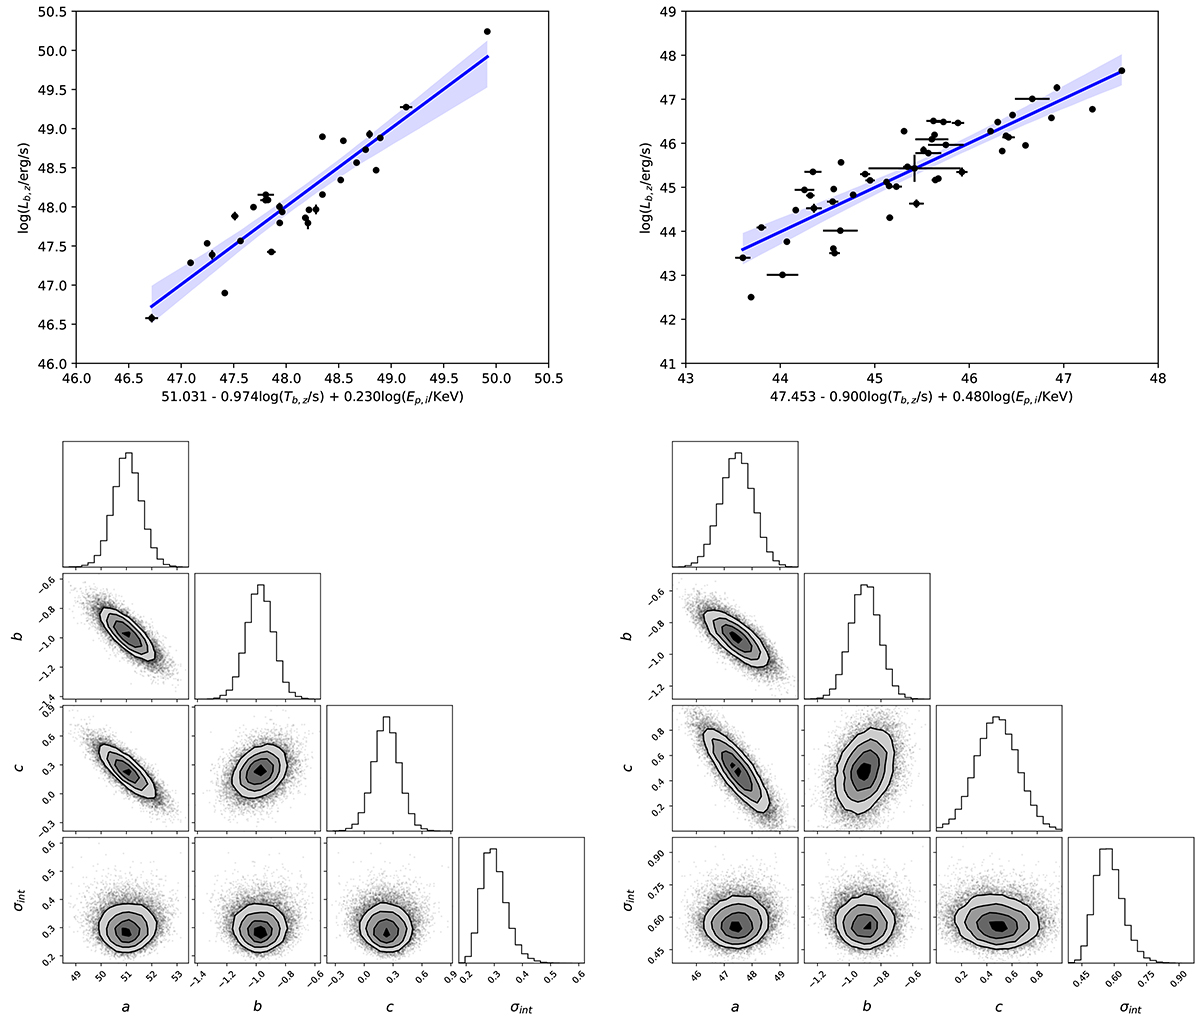
Correlation between luminosity Lb, z, the end time Tb, z, and the spectral peak energy Ep, i. Here we set Ωm = 0.315 and H0 = 67.36 km s−1 Mpc−1 for our calculations. The data points are the GRBs in the X-ray (upper left) and optical samples (upper right). The blue line corresponds to the best-fitting values of the data points with a 95% confidence band. The bottom panels show the 2D posterior contour corner diagrams for the X-ray (left panel) and optical samples (right panel).
Current usage metrics show cumulative count of Article Views (full-text article views including HTML views, PDF and ePub downloads, according to the available data) and Abstracts Views on Vision4Press platform.
Data correspond to usage on the plateform after 2015. The current usage metrics is available 48-96 hours after online publication and is updated daily on week days.
Initial download of the metrics may take a while.