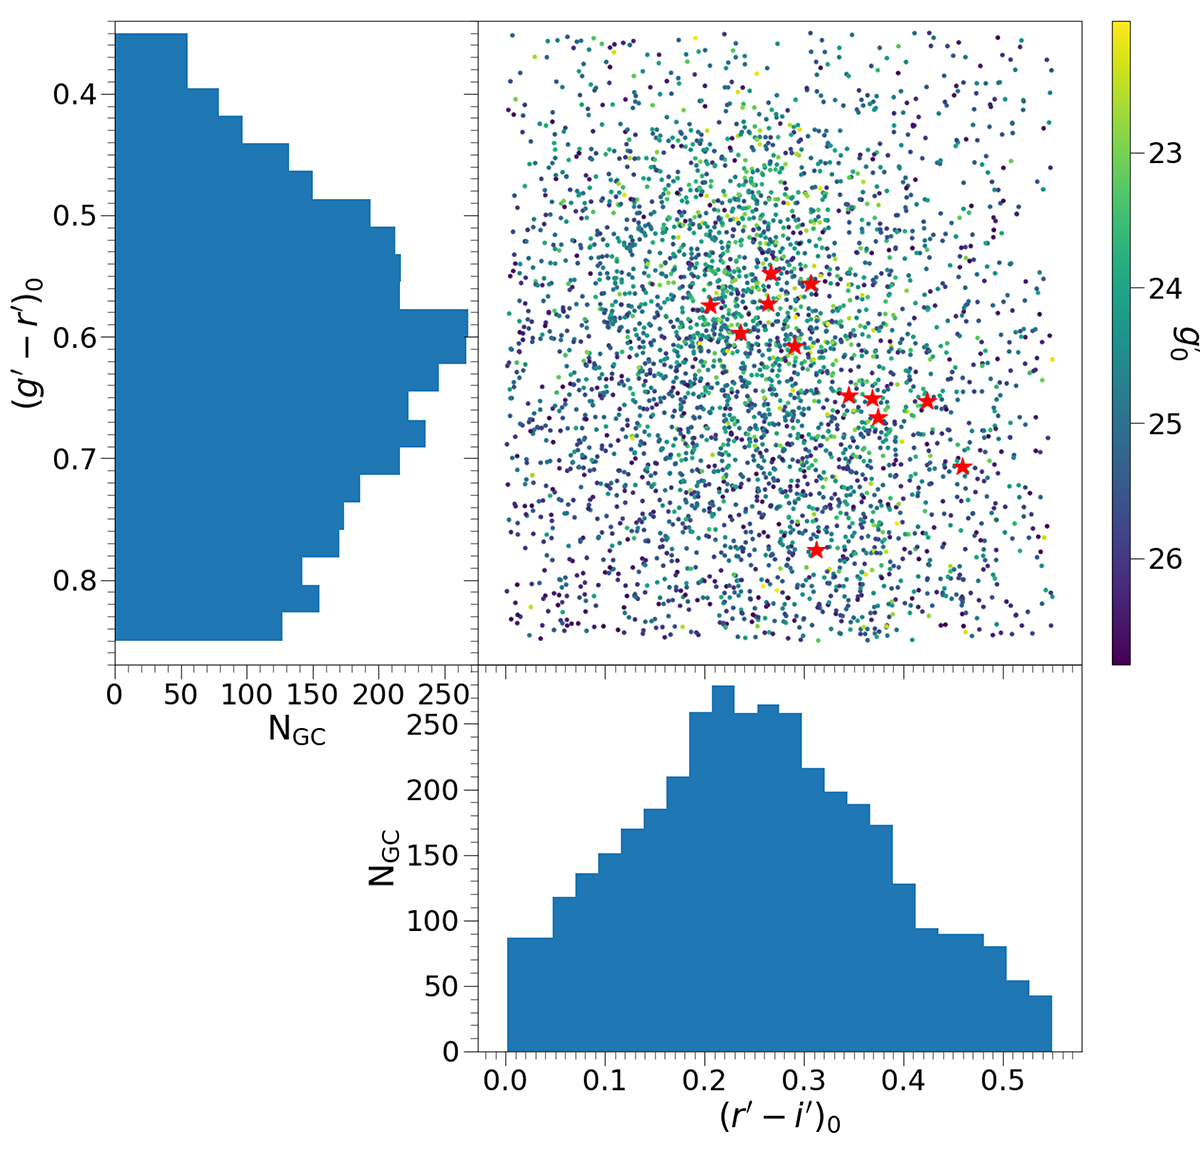
Fig. 8.
Download original image
x versus y color-color diagram of the 3818 globular cluster candidates selected according to their shape, color, and magnitude. The plot shows the (g′−r′)0 as a function of (r′−i′)0, color coded according to the g′0 magnitude. The left and bottom panels show the (g′−r′)0 and (r′−i′)0 color distributions, respectively. The red stars represent compact objects identified by Mieske et al. (2007) which were recovered in our selection. The properties of these objects are summarized in Table B.1.
Current usage metrics show cumulative count of Article Views (full-text article views including HTML views, PDF and ePub downloads, according to the available data) and Abstracts Views on Vision4Press platform.
Data correspond to usage on the plateform after 2015. The current usage metrics is available 48-96 hours after online publication and is updated daily on week days.
Initial download of the metrics may take a while.