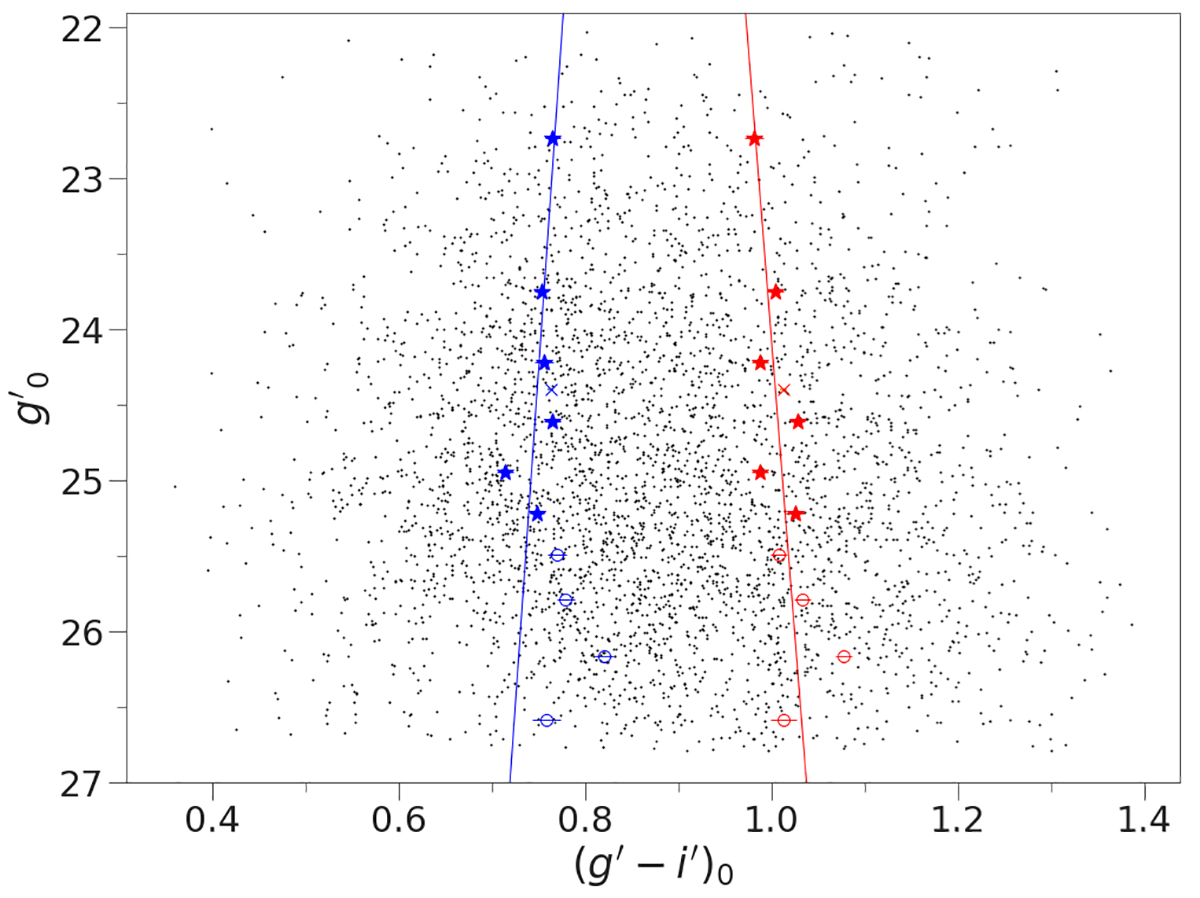
Fig. 7.
Download original image
Color-magnitude diagram of the 3818 globular cluster candidates. The plot shows the g′0 magnitude as a function of the (g′−i′)0 color. The blue and red points correspond to the peaks of the blue and red GC populations, obtained by forcing the fit of two Gaussians on each subsamples of GCs. The blue and red star symbols represent the bins for which the bimodal distribution was confirmed by the Akaike Information Criterion. The blue and red x symbols represent the peaks of the total population of GC candidates, whereas the circles represents the bins for which the Akaike Information Criterion gave a non-bimodal distribution. The blue and red lines correspond to the best linear fits for the peaks in the color distributions.
Current usage metrics show cumulative count of Article Views (full-text article views including HTML views, PDF and ePub downloads, according to the available data) and Abstracts Views on Vision4Press platform.
Data correspond to usage on the plateform after 2015. The current usage metrics is available 48-96 hours after online publication and is updated daily on week days.
Initial download of the metrics may take a while.