Open Access
Fig. 6.
Download original image
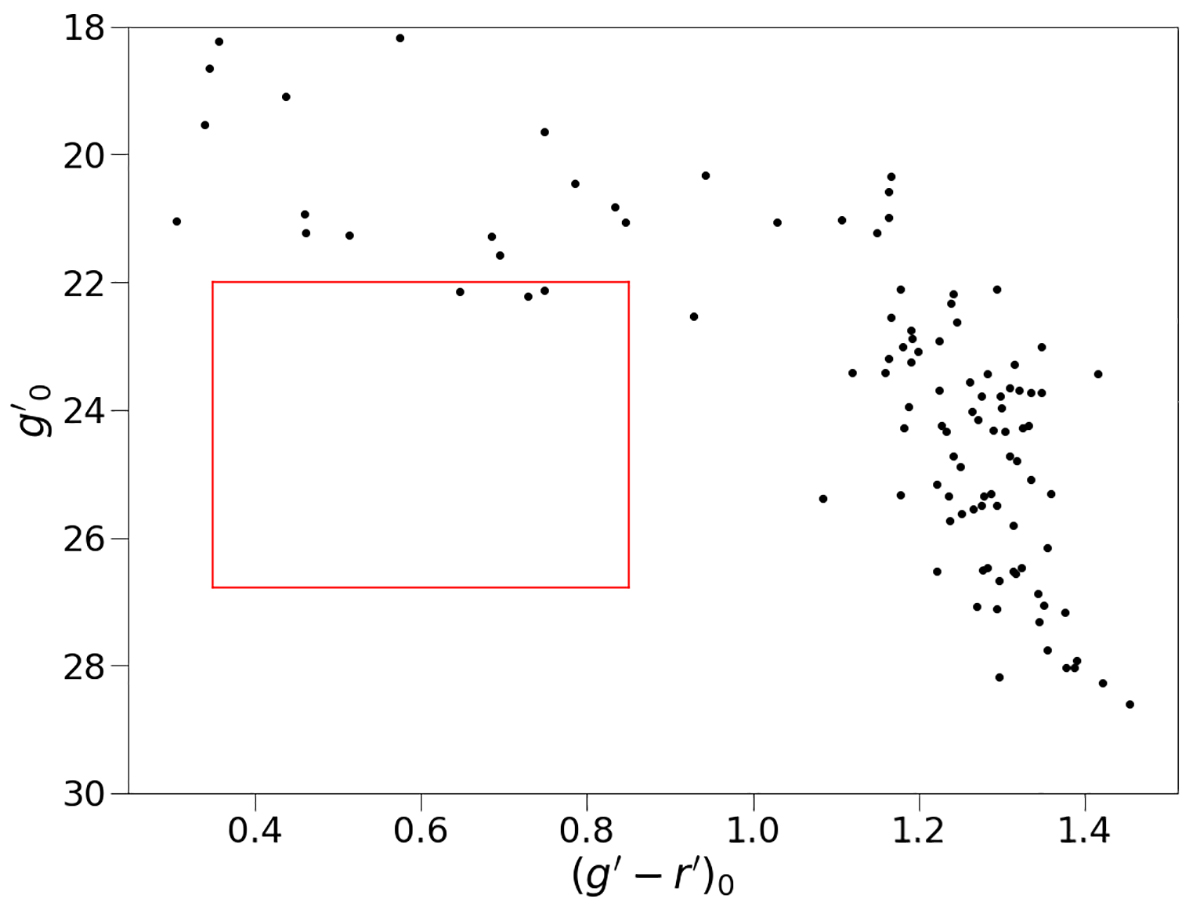
Color-magnitude diagram of the sources in the Besançon model simulation. The plot shows the g′0 magnitude as a function of the (g′−r′)0 color, for the sources in an area equal to that used for our background fields (6 × 1 arcmin2). The red square shows the limits given by our GCs selection criteria.
Current usage metrics show cumulative count of Article Views (full-text article views including HTML views, PDF and ePub downloads, according to the available data) and Abstracts Views on Vision4Press platform.
Data correspond to usage on the plateform after 2015. The current usage metrics is available 48-96 hours after online publication and is updated daily on week days.
Initial download of the metrics may take a while.