Fig. 20.
Download original image
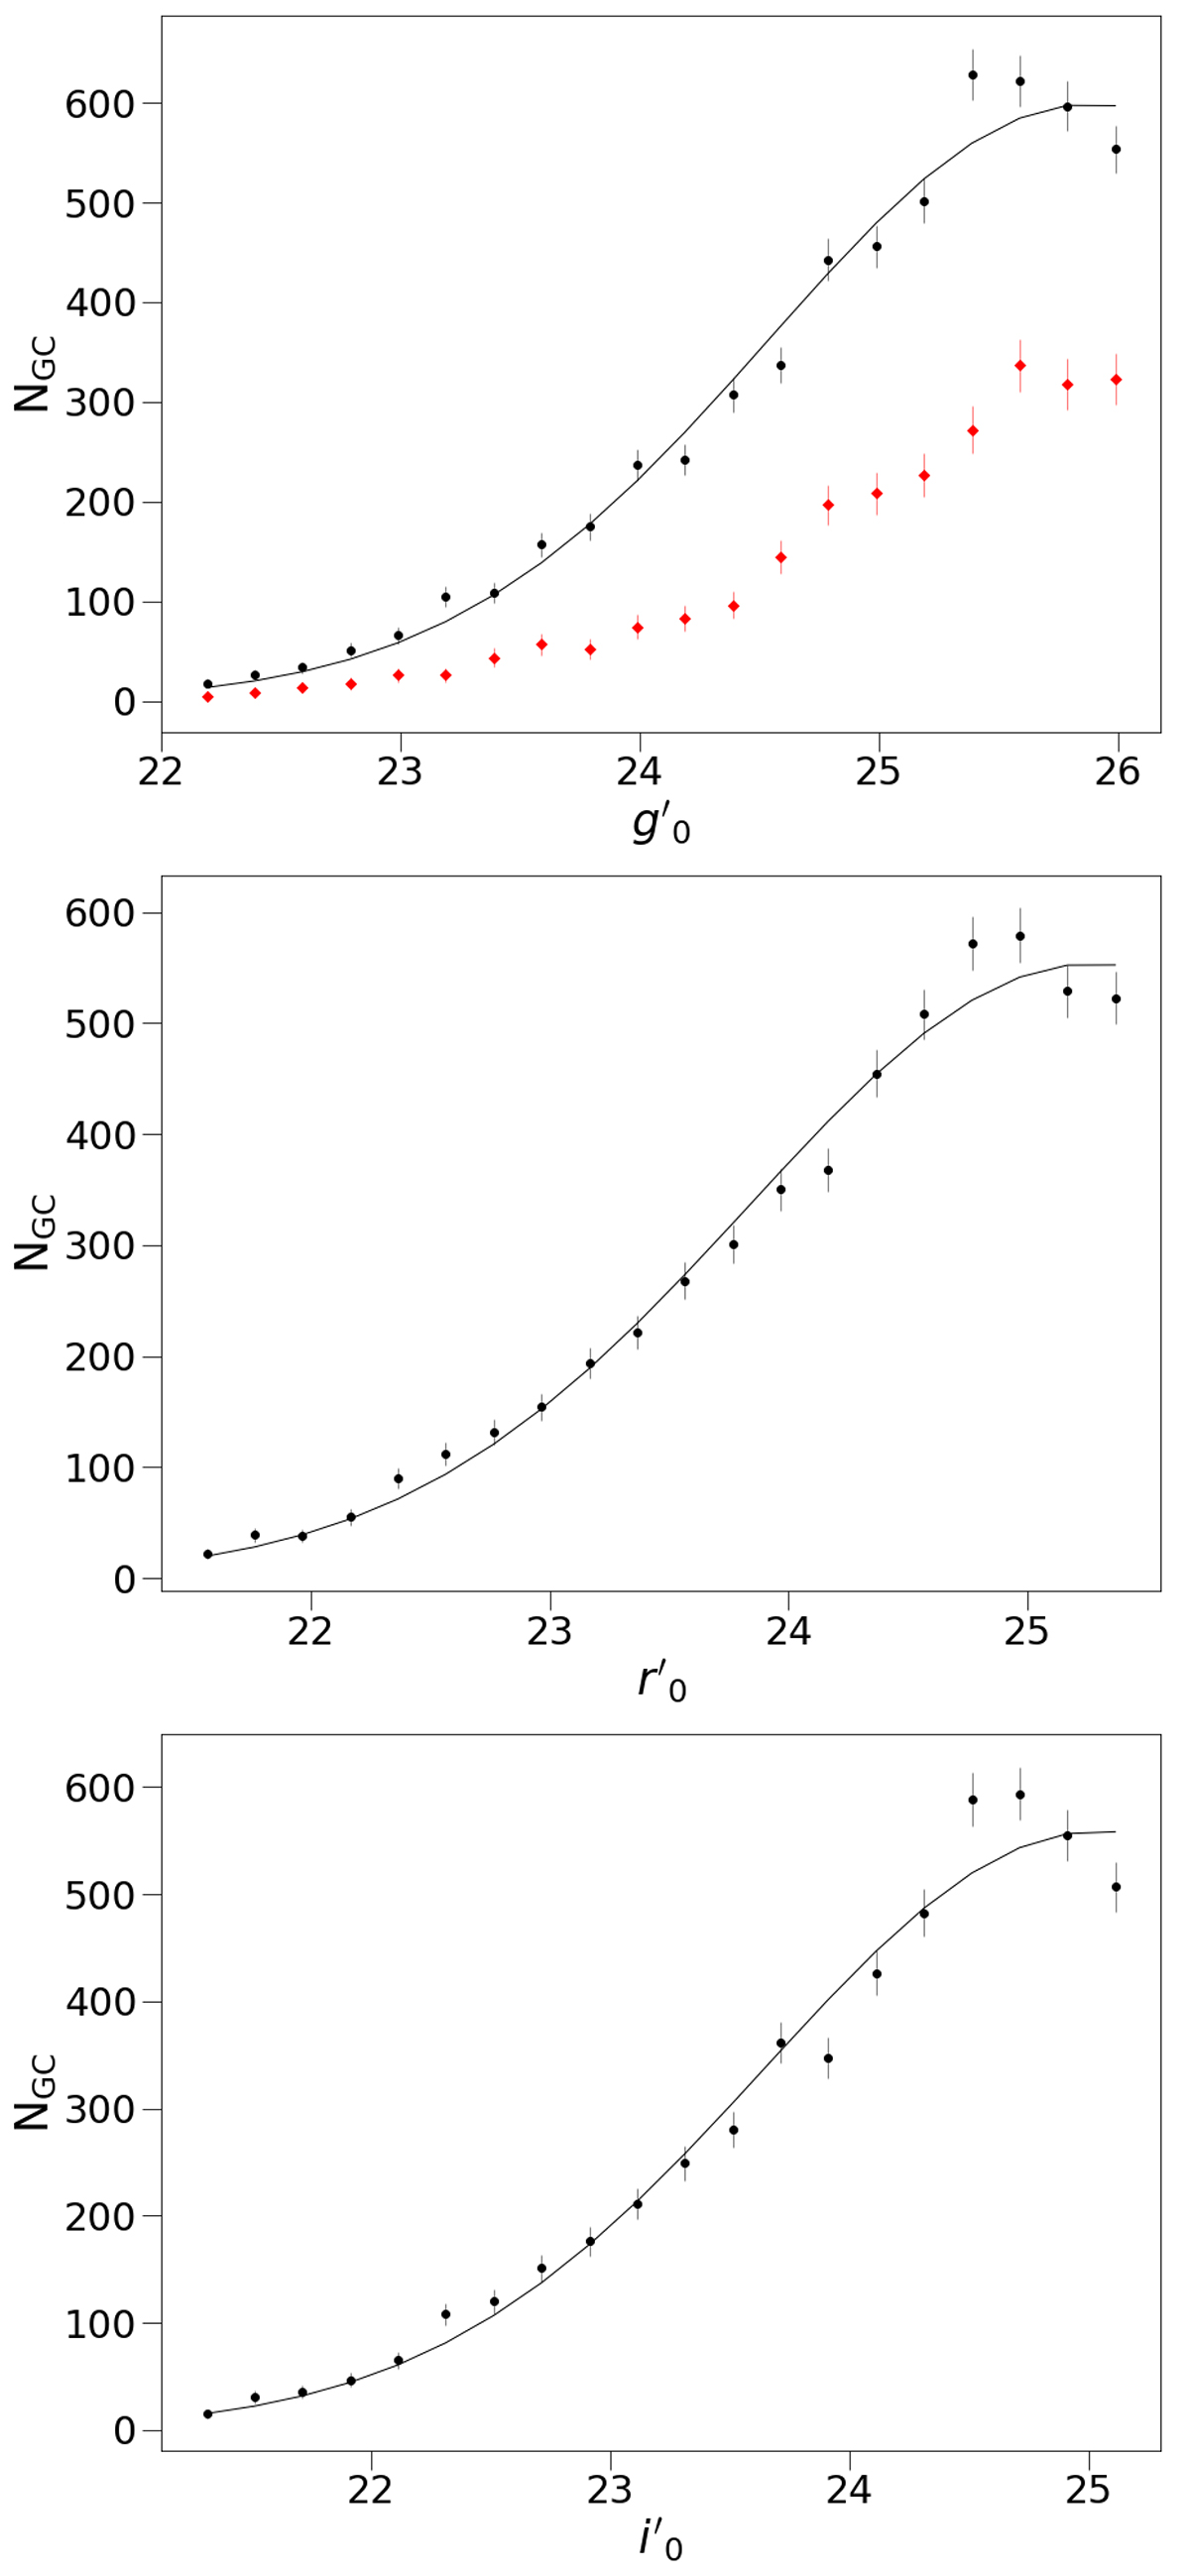
Globular cluster luminosity function. Top panel: GCLF in the g′ band, where the black points represent the number of clusters corrected for the completeness fraction divided in bins of 0.2 mag, the solid line represent the best fit Gaussian. The red diamonds represent the number of sources in the two rectangular regions considered for the background, corrected by the completeness fraction and normalized by the area. Middle and Bottom panels: GCLF in the r′ and i′ band, where the points represent the number of clusters corrected for the completeness fraction divided in bins of 0.2 mag, and the blue lines correspond to the magnitude of the completeness limit.
Current usage metrics show cumulative count of Article Views (full-text article views including HTML views, PDF and ePub downloads, according to the available data) and Abstracts Views on Vision4Press platform.
Data correspond to usage on the plateform after 2015. The current usage metrics is available 48-96 hours after online publication and is updated daily on week days.
Initial download of the metrics may take a while.