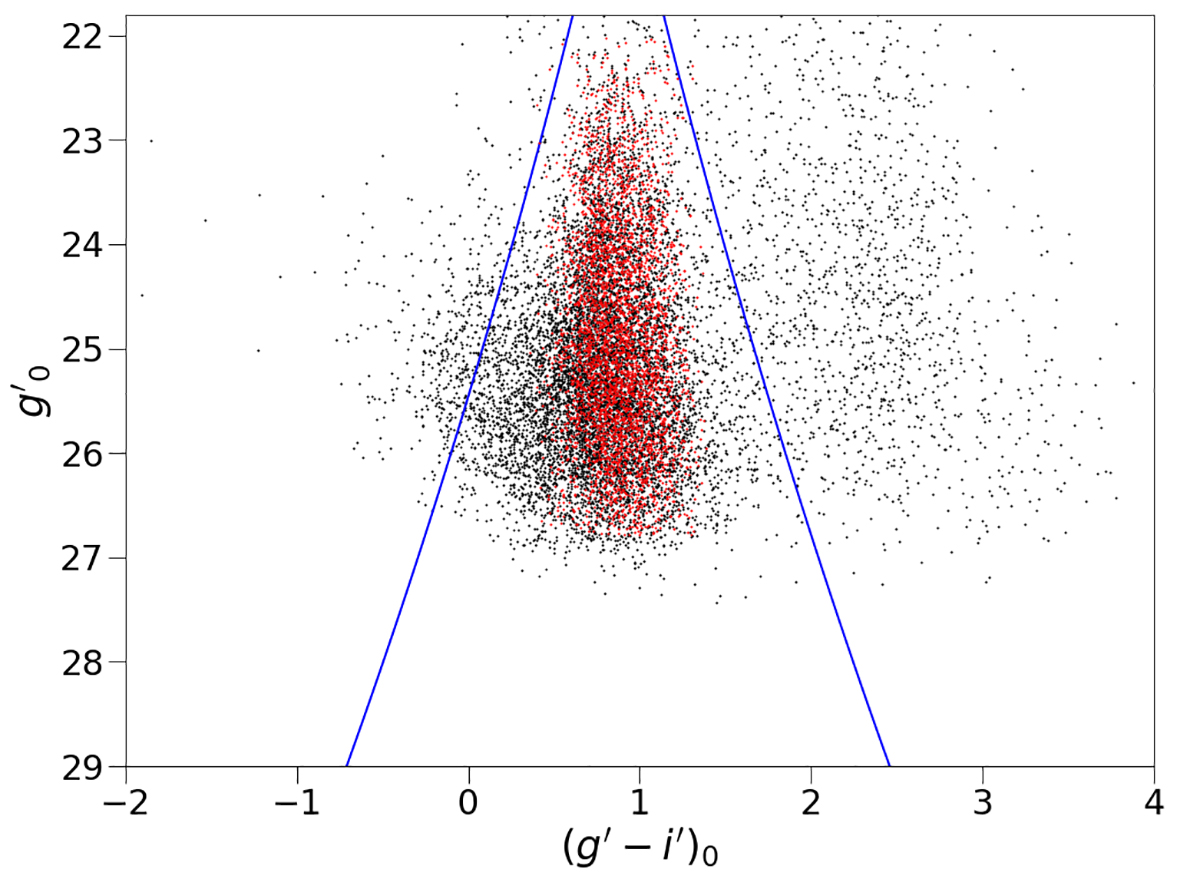
Fig. 19.
Download original image
Color-magnitude diagram of the GC candidates, zooming into the plot shown in Fig. 3. The black dots represent the full sample of point-like sources in our field. The red dots are the 3818 GC candidates defined by the two-color and magnitude selection applied for the analysis in previous sections. The blue lines represent the more inclusive single color (g′−i′)0 selection that we adopt for the analysis of the GCLF, see text for details. This corresponding sample yields 6755 candidates for the calculation of the GCLF.
Current usage metrics show cumulative count of Article Views (full-text article views including HTML views, PDF and ePub downloads, according to the available data) and Abstracts Views on Vision4Press platform.
Data correspond to usage on the plateform after 2015. The current usage metrics is available 48-96 hours after online publication and is updated daily on week days.
Initial download of the metrics may take a while.