Fig. 18.
Download original image
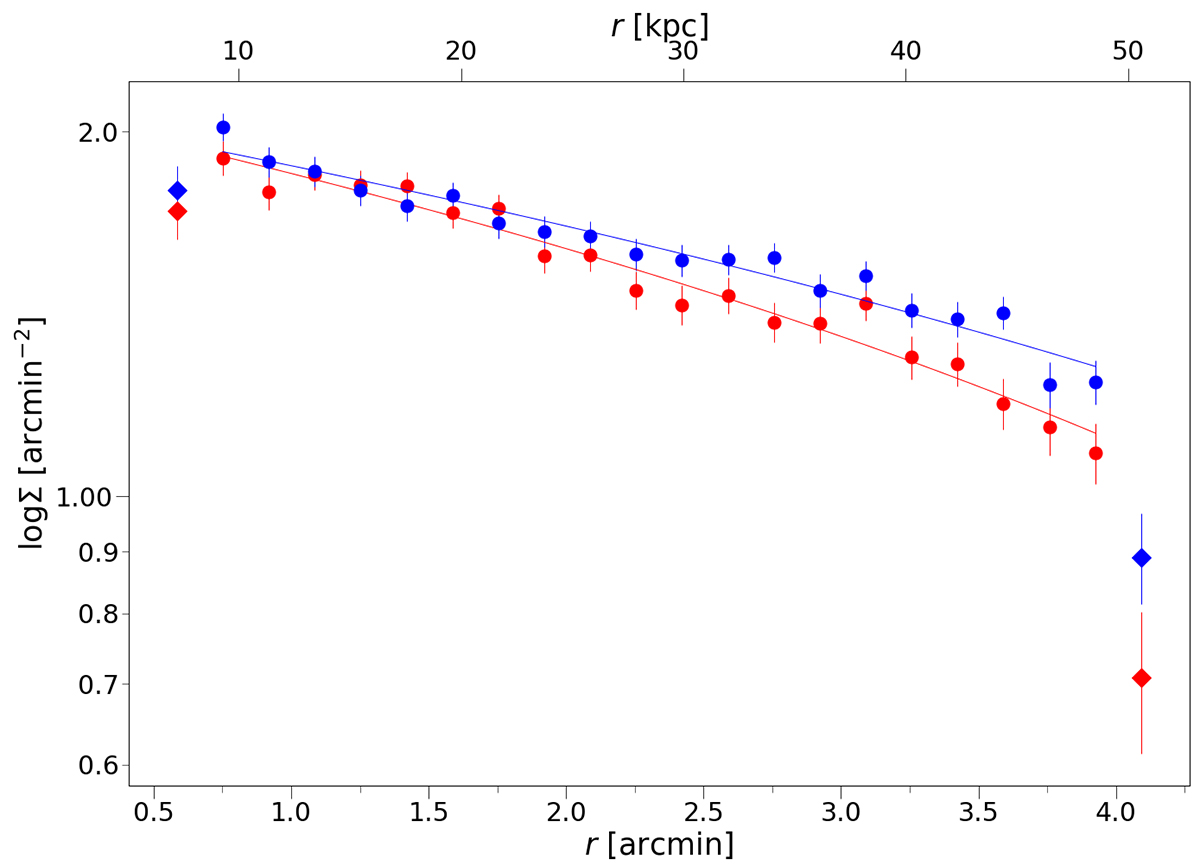
Radial number density profiles for the blue and red GC populations, in the case of a variable (g′−i′)0 color separation between the blue and red GC populations. The plot show the logarithm of the density of clusters (logΣ) as a function of the galactocentric distance (r), for the blue and red populations defined according to Eqs. (10) and (11). The diamond symbols show the innermost and outermost bins that were not included in the fit, whereas the lines show the best linear fits.
Current usage metrics show cumulative count of Article Views (full-text article views including HTML views, PDF and ePub downloads, according to the available data) and Abstracts Views on Vision4Press platform.
Data correspond to usage on the plateform after 2015. The current usage metrics is available 48-96 hours after online publication and is updated daily on week days.
Initial download of the metrics may take a while.