Fig. 17.
Download original image
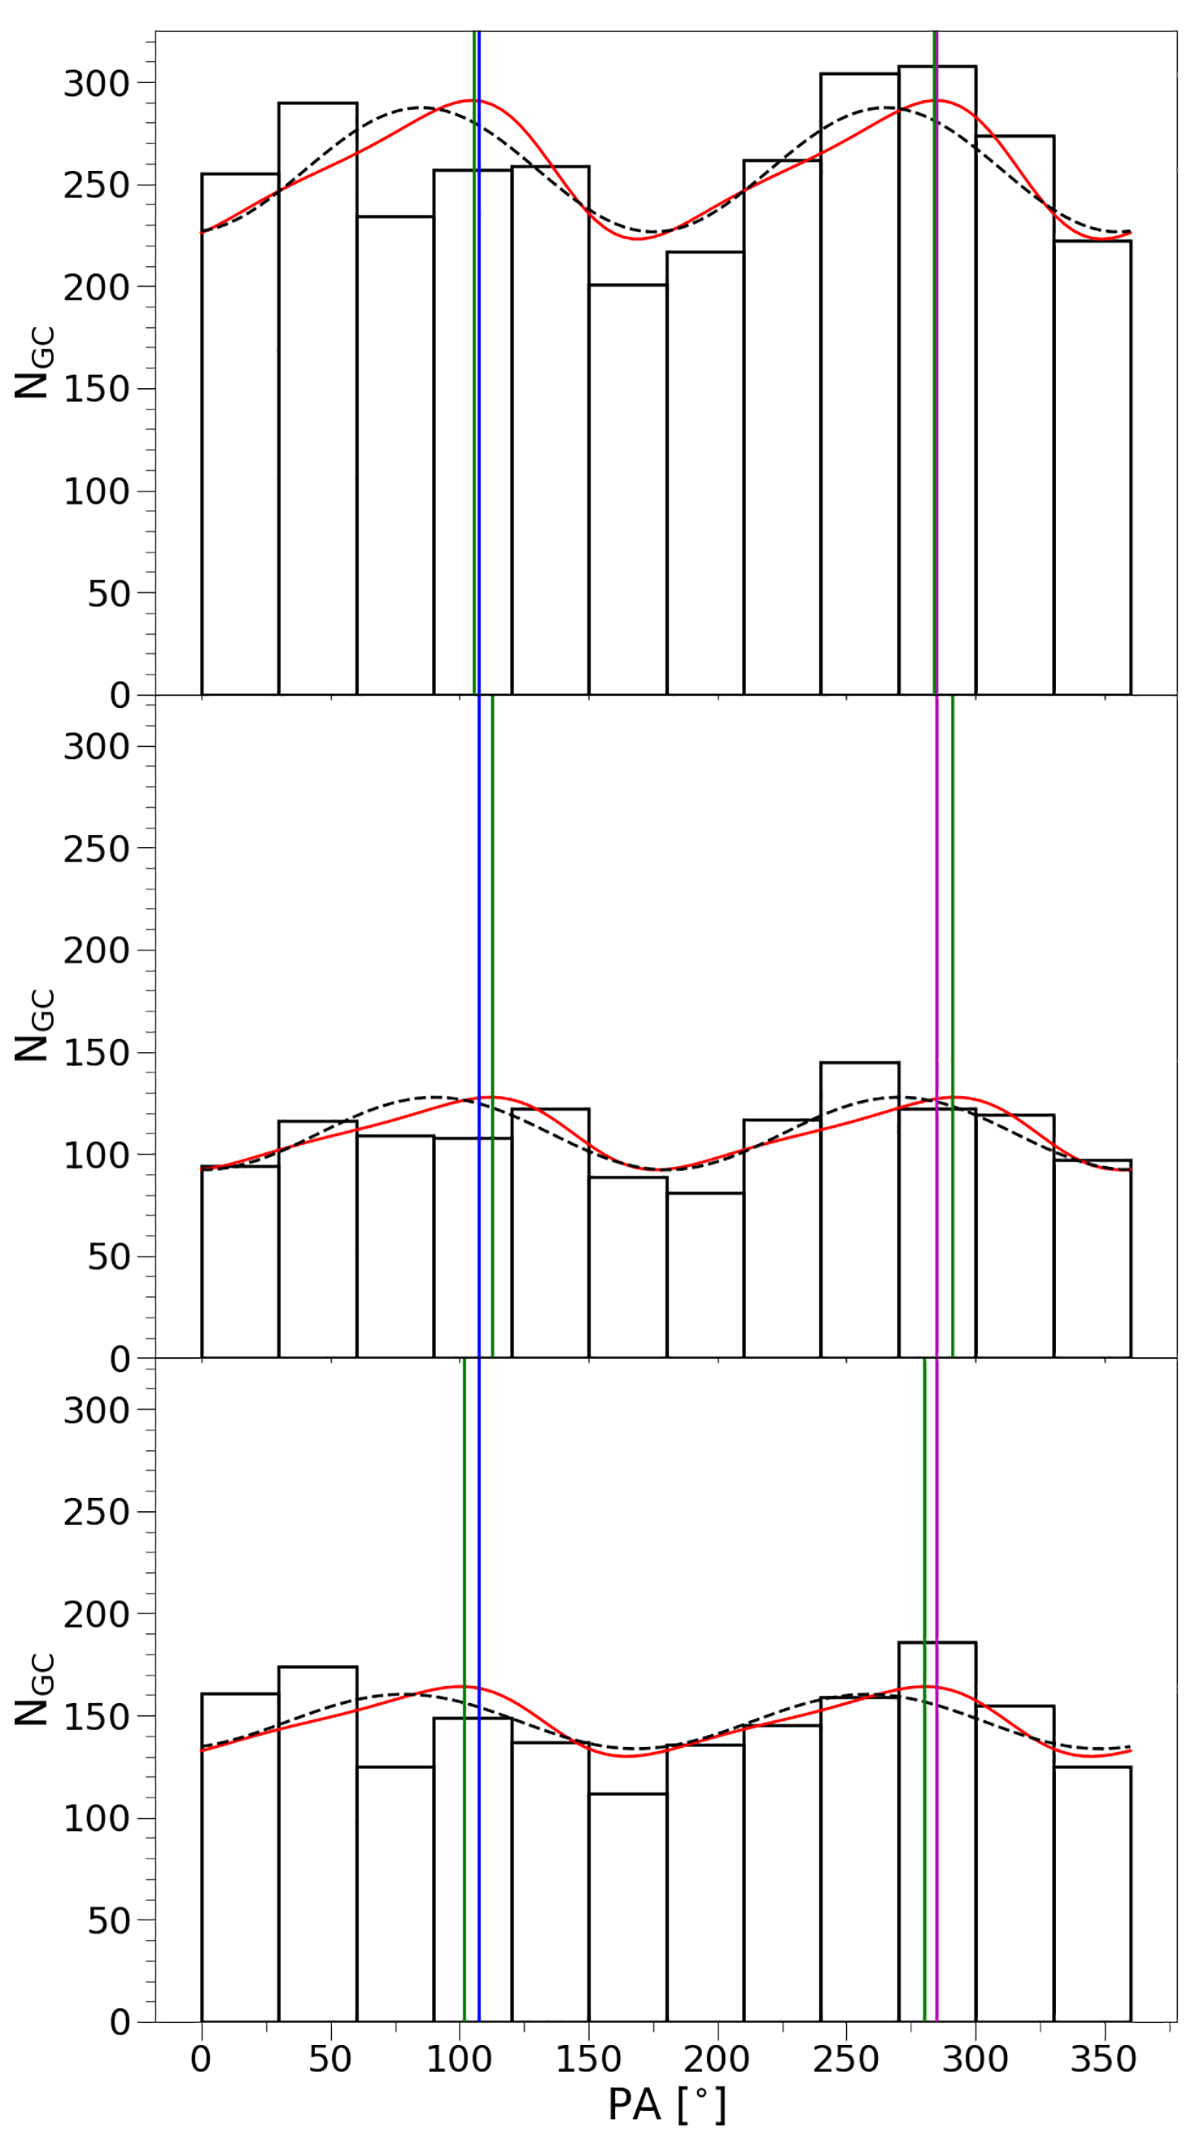
Azimuthal distribution of 3083 globular cluster candidates. The plots show the number of clusters (NGC) as a function of the position angle (PA), divided in angular bins of 30°. The red line represents the interpolation with the function described in Eq. (8) to the data, the blue and magenta lines represent the angular positions of NGC 4709 and NGC 4696B respectively, the green lines represent the position angle of the peaks, and the dashed black lines represent the fit with Eq. (9). The different panels show the distributions of the total (top panel), red (middle panel), and blue (lower panel) GC samples.
Current usage metrics show cumulative count of Article Views (full-text article views including HTML views, PDF and ePub downloads, according to the available data) and Abstracts Views on Vision4Press platform.
Data correspond to usage on the plateform after 2015. The current usage metrics is available 48-96 hours after online publication and is updated daily on week days.
Initial download of the metrics may take a while.