Fig. 16.
Download original image
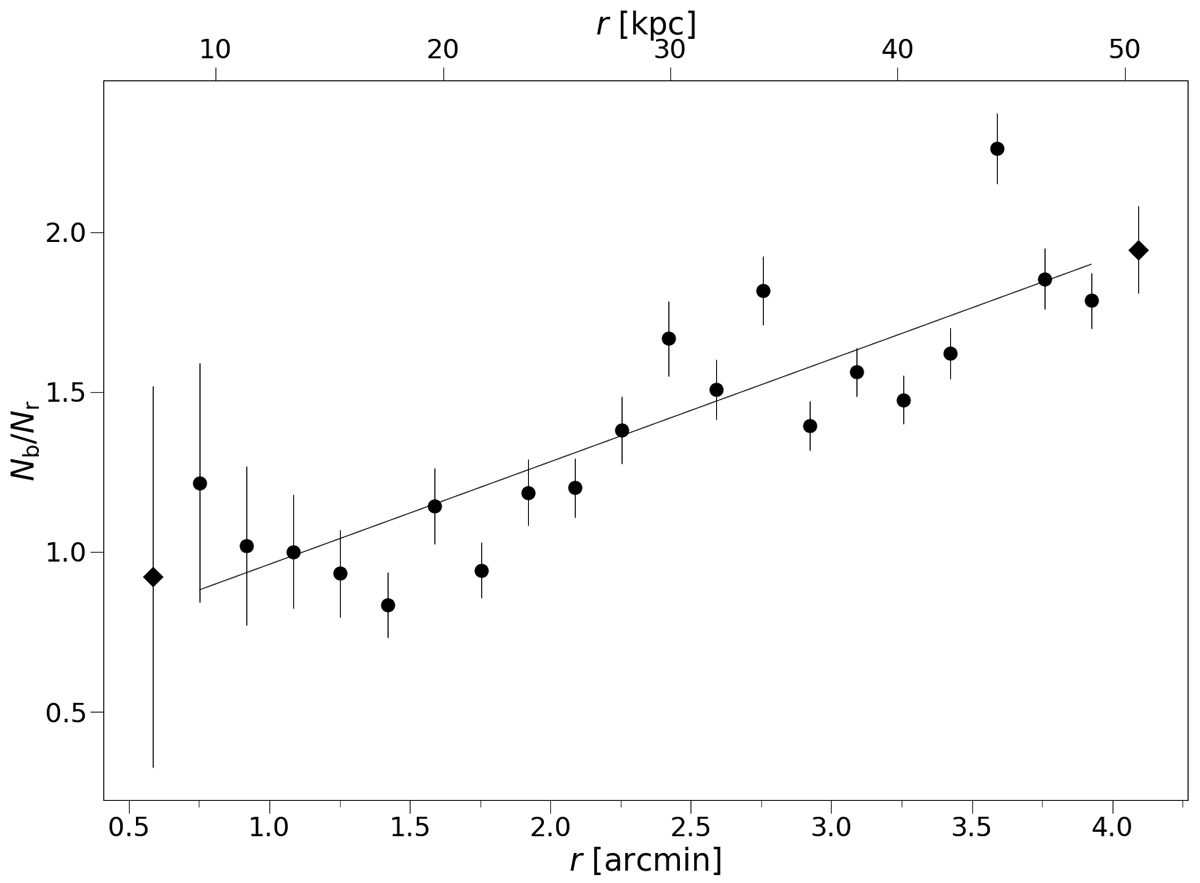
Ratio between the blue and red populations of globular clusters. We considered radial bins of 0.167 arcmin, as in the radial density plots. The plot shows the ratio of blue to red clusters (Nblue/Nred) as a function of the distance from the center of the galaxy (r). The diamonds represent data not included in the study in order to avoid incompleteness effects in the innermost bin. The line shows the result of the linear fit to the data.
Current usage metrics show cumulative count of Article Views (full-text article views including HTML views, PDF and ePub downloads, according to the available data) and Abstracts Views on Vision4Press platform.
Data correspond to usage on the plateform after 2015. The current usage metrics is available 48-96 hours after online publication and is updated daily on week days.
Initial download of the metrics may take a while.