Open Access
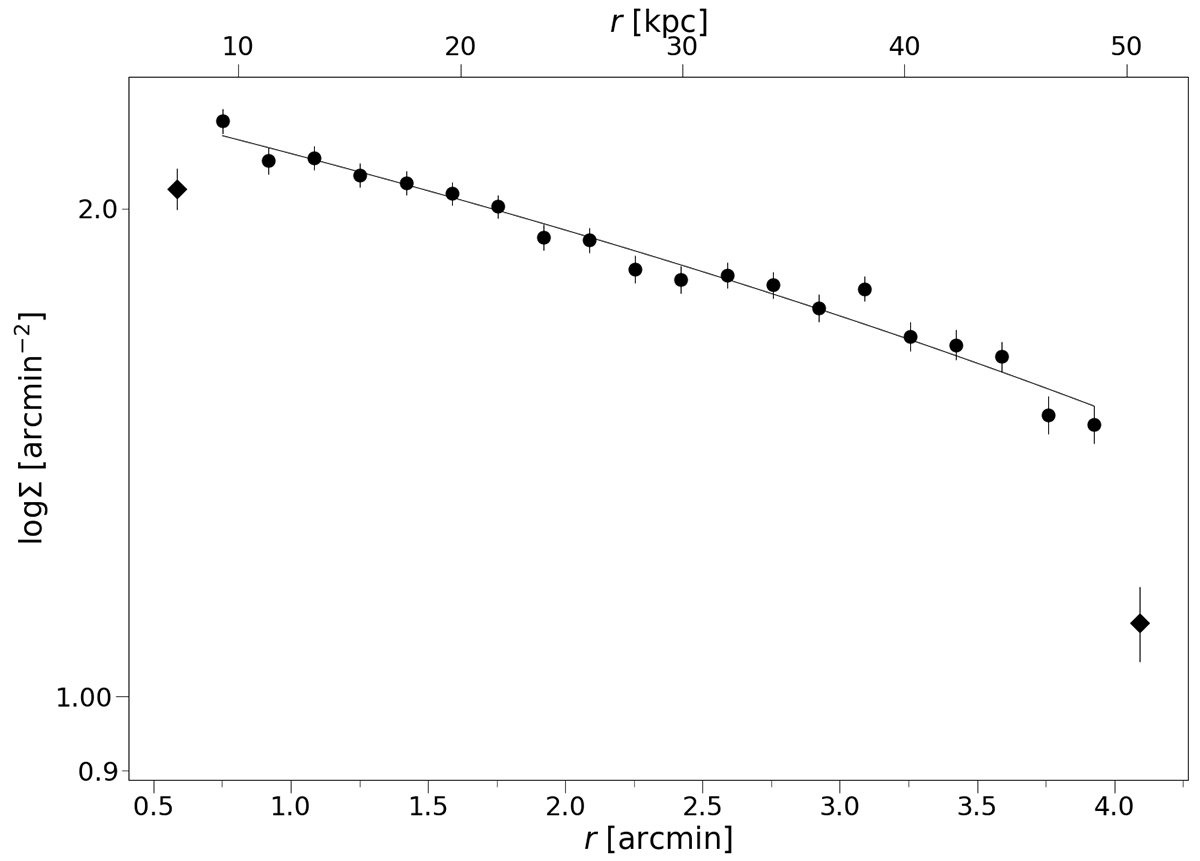
Fig. 14.
Download original image
Radial profile of the clusters’ surface density. The plot shows the density of GCs (logΣ) as a function of the distance to the center of the galaxy (r). The diamond symbols represent data not included in the regression (indicated by the solid line), in order to minimize incompleteness effects.
Current usage metrics show cumulative count of Article Views (full-text article views including HTML views, PDF and ePub downloads, according to the available data) and Abstracts Views on Vision4Press platform.
Data correspond to usage on the plateform after 2015. The current usage metrics is available 48-96 hours after online publication and is updated daily on week days.
Initial download of the metrics may take a while.