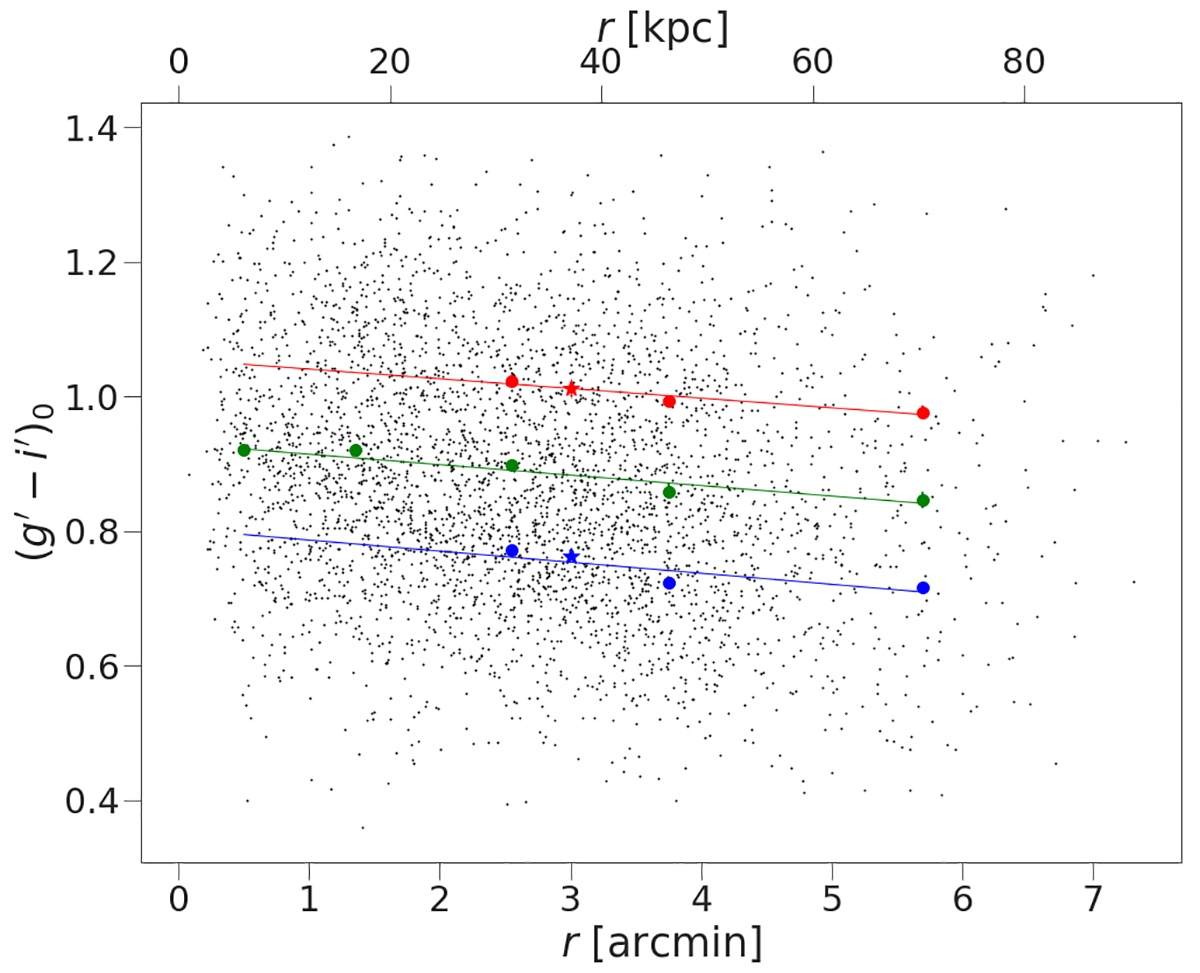
Fig. 12.
Download original image
(g′−i′)0 color versus radius plot. The black dots represent the 3818 GC candidates. The blue and red dots are the blue and red peaks of the color distributions divided into bins as explained in this section. The green dots represent the medians between the blue and red peaks. The blue, red, and green lines are the linear fit of the peaks. The blue and red stars represent the peaks of the total color distribution. The effective radius of the galaxy is reff = 1.7′, which at the distance of NGC 4696 corresponds to 21.02 kpc.
Current usage metrics show cumulative count of Article Views (full-text article views including HTML views, PDF and ePub downloads, according to the available data) and Abstracts Views on Vision4Press platform.
Data correspond to usage on the plateform after 2015. The current usage metrics is available 48-96 hours after online publication and is updated daily on week days.
Initial download of the metrics may take a while.