Open Access
Fig. 11.
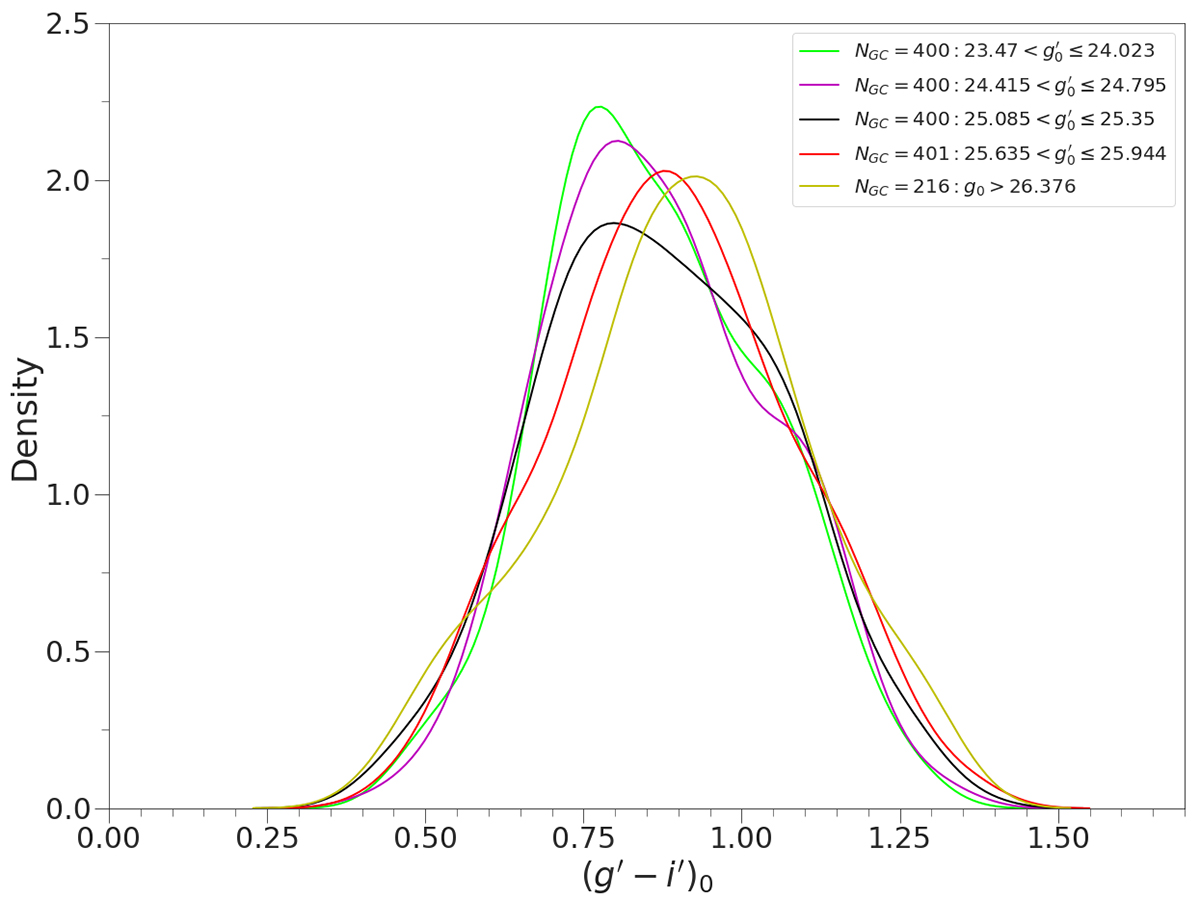
Download original image
Color distribution of the subsamples of GCs. Each curve shows the color distribution within the indicated magnitude ranges. The widths of the magnitude bins were chosen to have a comparable number of sources per range.
Current usage metrics show cumulative count of Article Views (full-text article views including HTML views, PDF and ePub downloads, according to the available data) and Abstracts Views on Vision4Press platform.
Data correspond to usage on the plateform after 2015. The current usage metrics is available 48-96 hours after online publication and is updated daily on week days.
Initial download of the metrics may take a while.