Fig. 10.
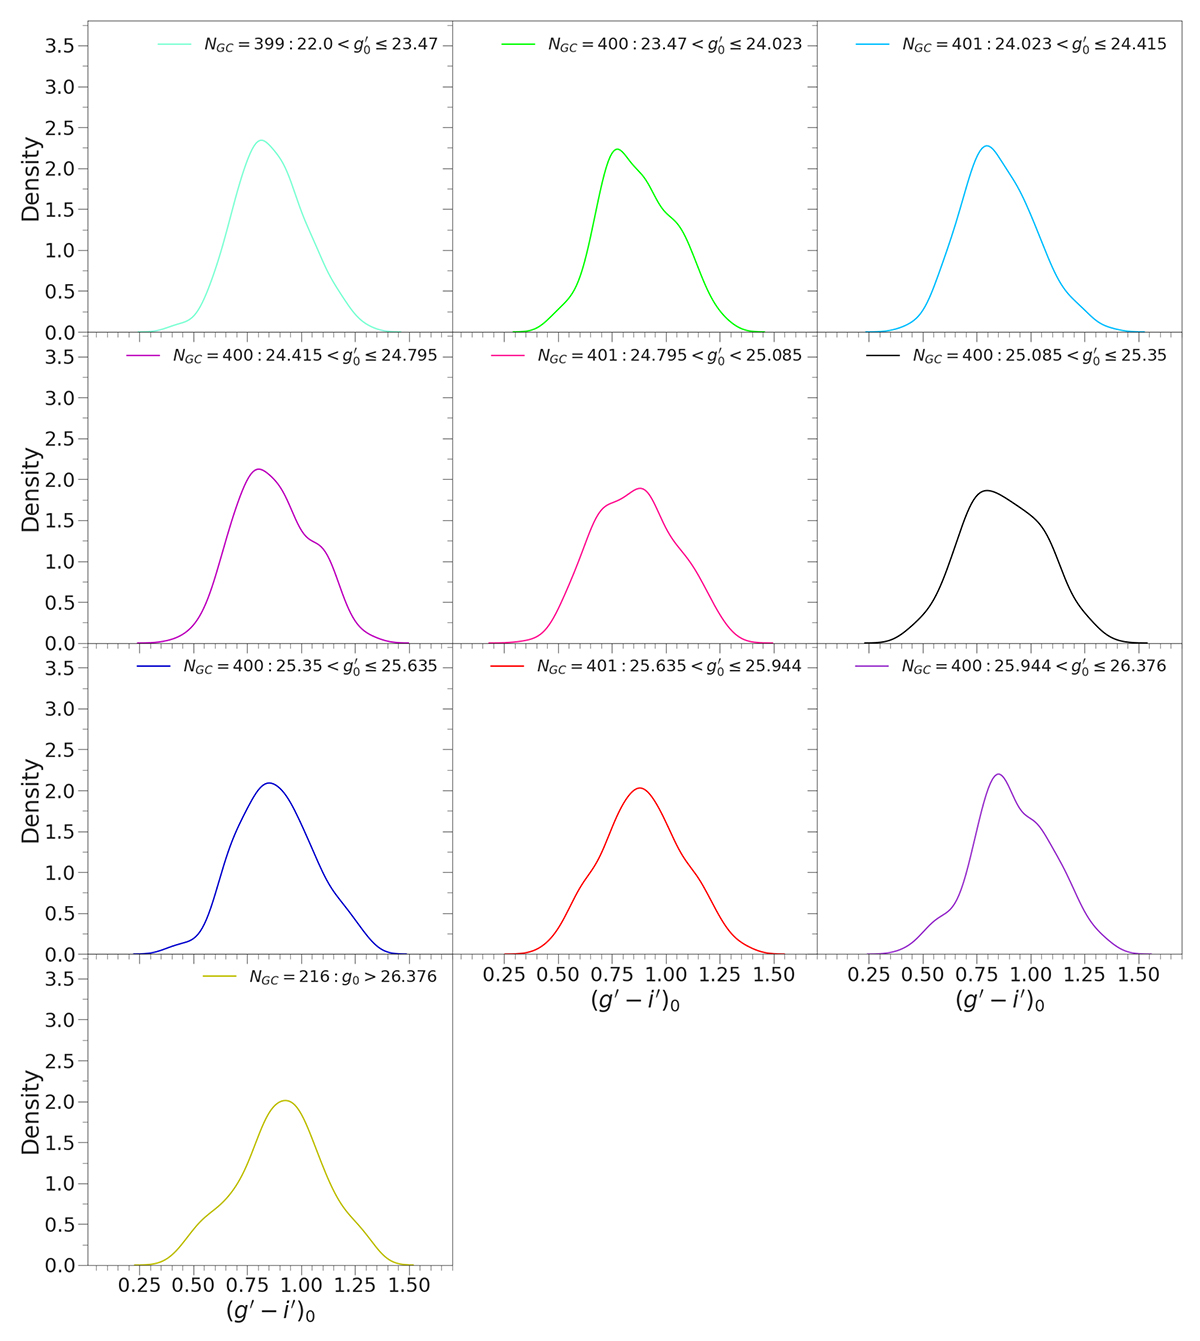
Download original image
Color distribution of the subsamples of globular clusters. The plots go from the brightest magnitude bin (top left) to the faintest magnitude bin (bottom). The legends indicate the number of GCs for the considered bin. The number of components that better fit the color distributions in each bin according to the Akaike Information Criterion are summarized in Table 4.
Current usage metrics show cumulative count of Article Views (full-text article views including HTML views, PDF and ePub downloads, according to the available data) and Abstracts Views on Vision4Press platform.
Data correspond to usage on the plateform after 2015. The current usage metrics is available 48-96 hours after online publication and is updated daily on week days.
Initial download of the metrics may take a while.