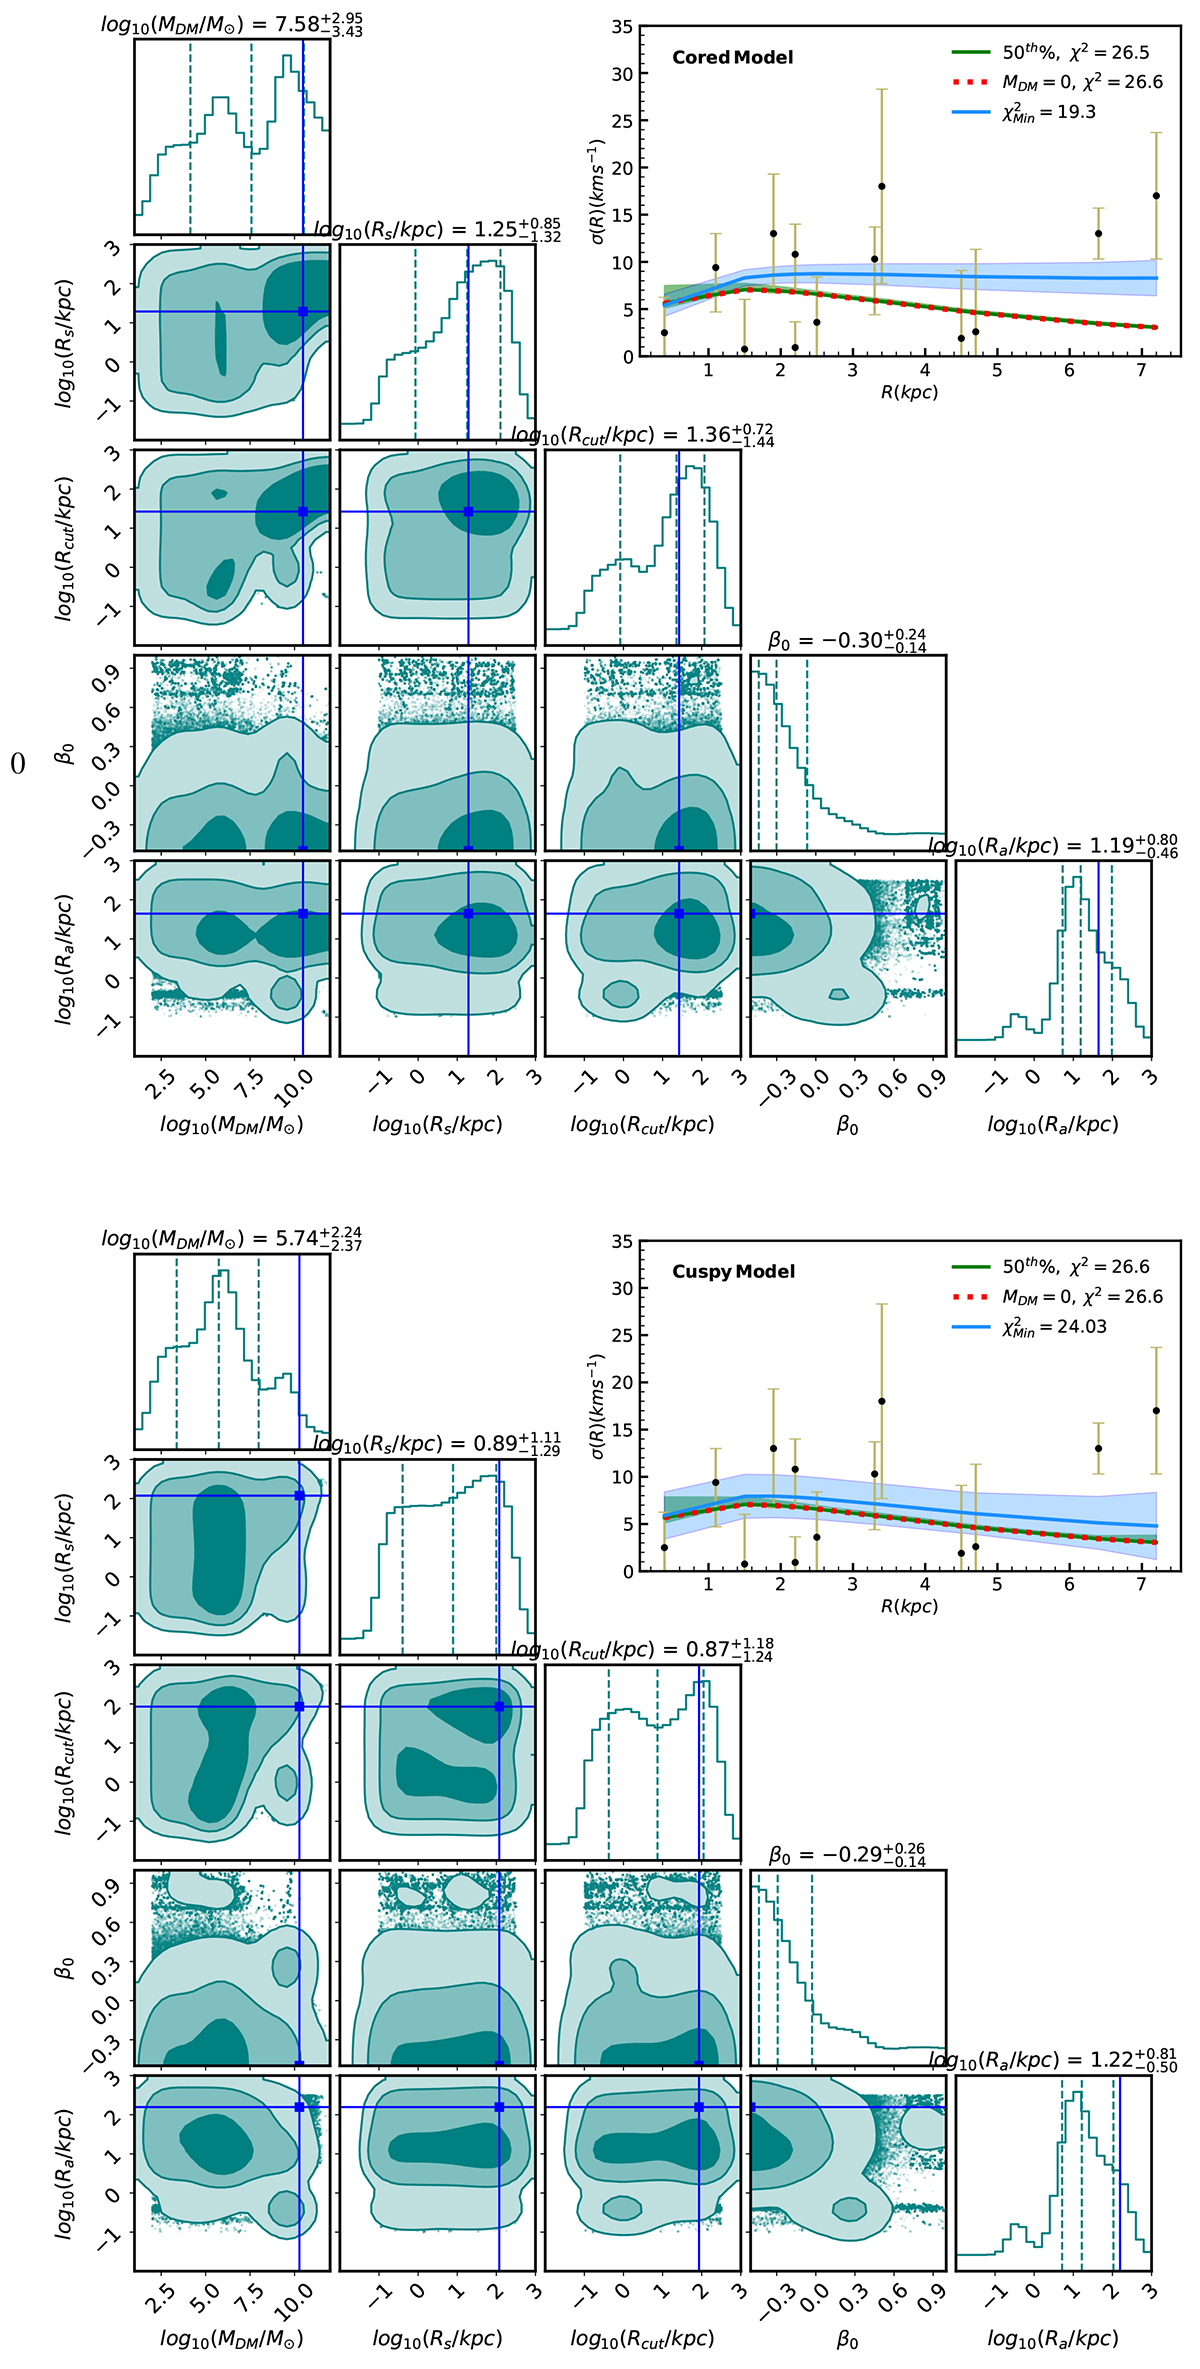
Fig. 1.
Download original image
Posterior probability distribution corresponding to the cored (top panel) and cuspy (bottom panel) dark matter halo. The dashed teal lines depict the 16th, 50th, and 84th percentiles of the posterior probability distribution. The blue line indicates the parameters corresponding to the model with minimum χ2. In the top right corner, the model based on the 50th percentile of the posterior and the model with minimum χ2 are shown using green and blue lines, respectively. The shaded blue and green regions represent the 1σ confidence interval. The dotted red line depicts the model with zero dark matter (MDM = 0).
Current usage metrics show cumulative count of Article Views (full-text article views including HTML views, PDF and ePub downloads, according to the available data) and Abstracts Views on Vision4Press platform.
Data correspond to usage on the plateform after 2015. The current usage metrics is available 48-96 hours after online publication and is updated daily on week days.
Initial download of the metrics may take a while.