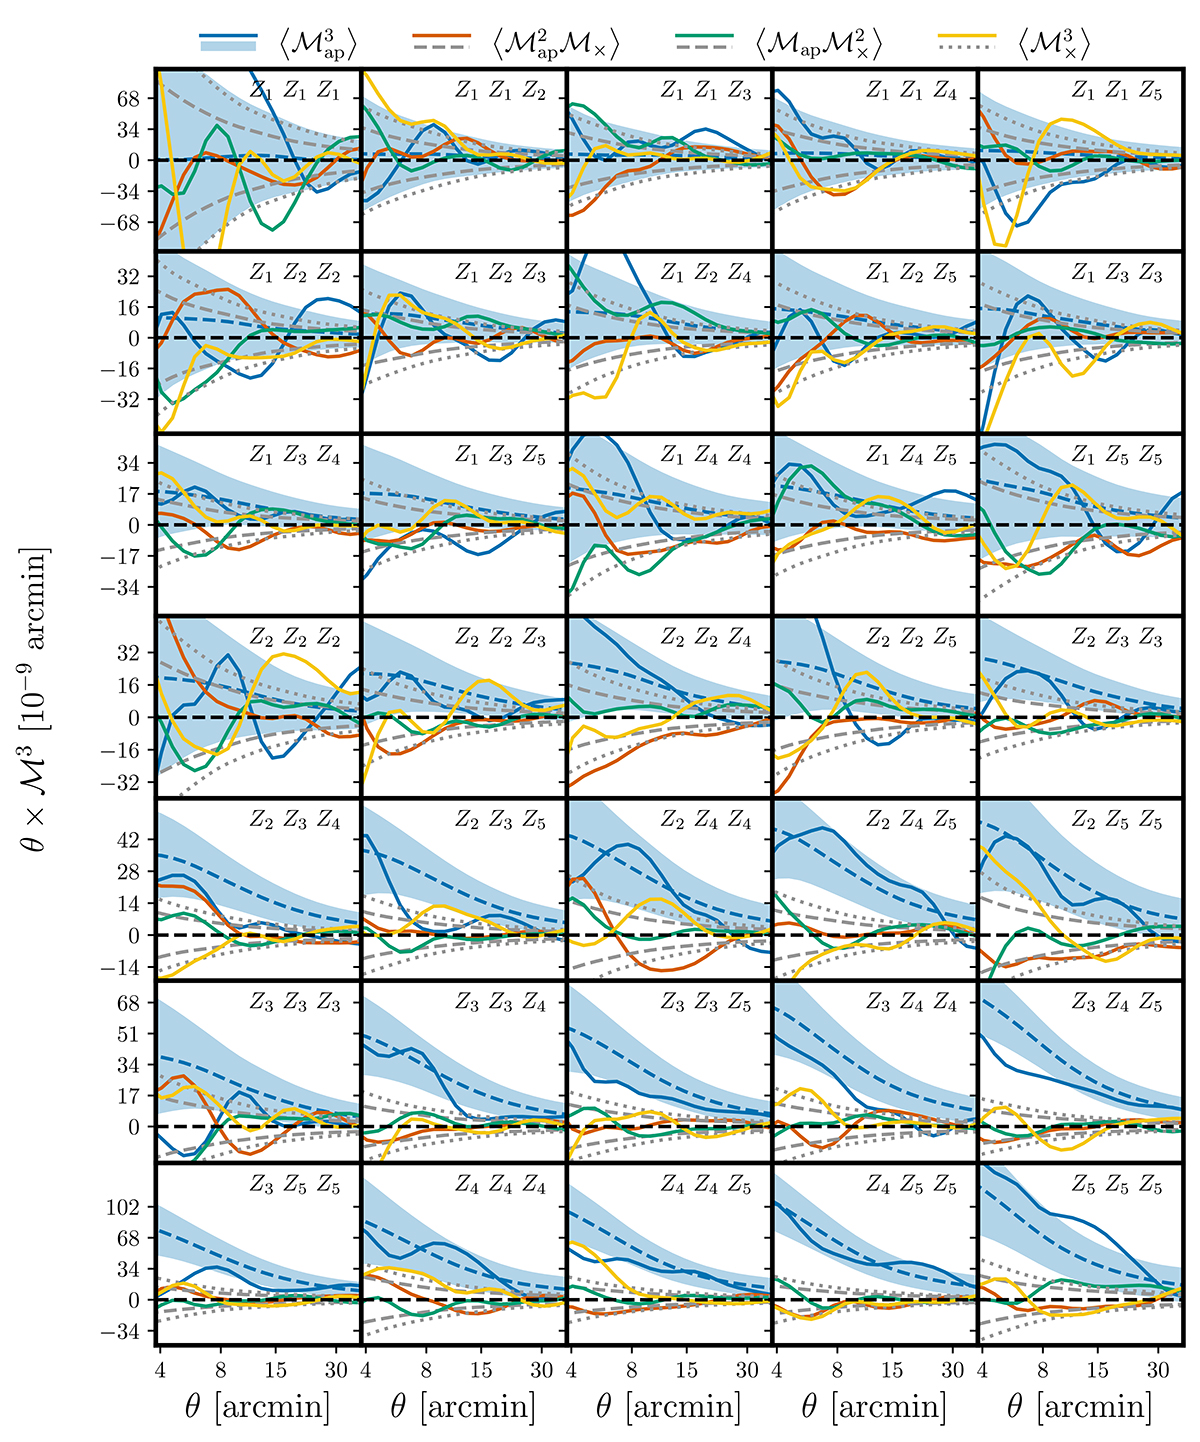
Fig. 8.
Download original image
Tomographic third-order aperture mass statistics in the KiDS-1000 data. In each panel, we show the measured statistics for a particular set of tomographic bins. The ℳap3 signal is plotted as a solid blue line, while the other solid lines indicate the remaining third-order measures. We also show the mean and the 1σ error interval for the third-order aperture mass within the T17 ensemble as a dashed blue line and a blue contour. The boundaries of the 1σ error interval for the remaining aperture measures are shown as dashed and dotted gray curves.
Current usage metrics show cumulative count of Article Views (full-text article views including HTML views, PDF and ePub downloads, according to the available data) and Abstracts Views on Vision4Press platform.
Data correspond to usage on the plateform after 2015. The current usage metrics is available 48-96 hours after online publication and is updated daily on week days.
Initial download of the metrics may take a while.