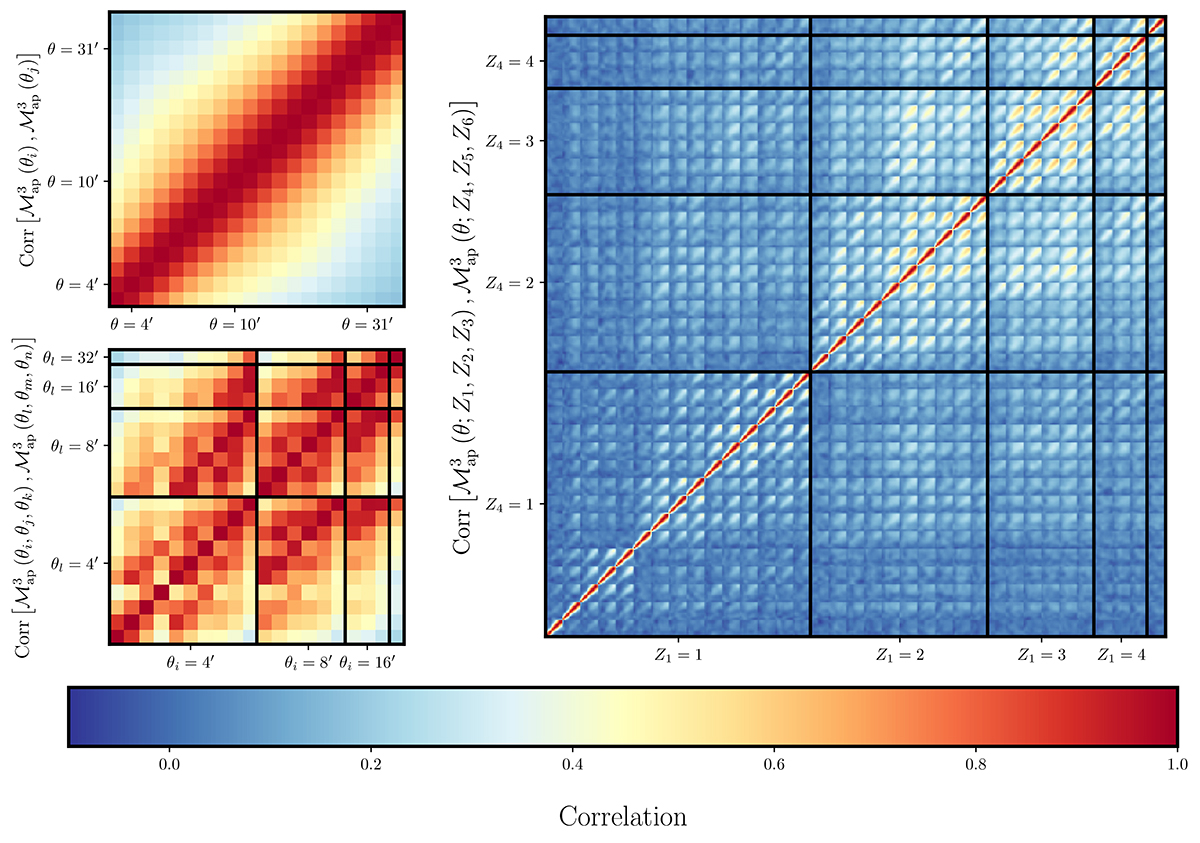
Fig. 6.
Download original image
Correlation matrices of third-order aperture mass measures in the T17 ensemble. Shown are the results for the non-tomographic, equal-scale statistics (top left), the non-tomographic unequal-scale statistics (bottom left), and the tomographic equal-scale statistics (right-hand side). We order the statistics such that θi ≤ θj ≤ θk and Z1 ≤ Z2 ≤ Z3, meaning that each of the “small” 352 squares in the covariance matrix on the right-hand side corresponds to the cross-covariance of the statistics for fixed tomographic redshift bin combinations.
Current usage metrics show cumulative count of Article Views (full-text article views including HTML views, PDF and ePub downloads, according to the available data) and Abstracts Views on Vision4Press platform.
Data correspond to usage on the plateform after 2015. The current usage metrics is available 48-96 hours after online publication and is updated daily on week days.
Initial download of the metrics may take a while.