Fig. F.1.
Download original image
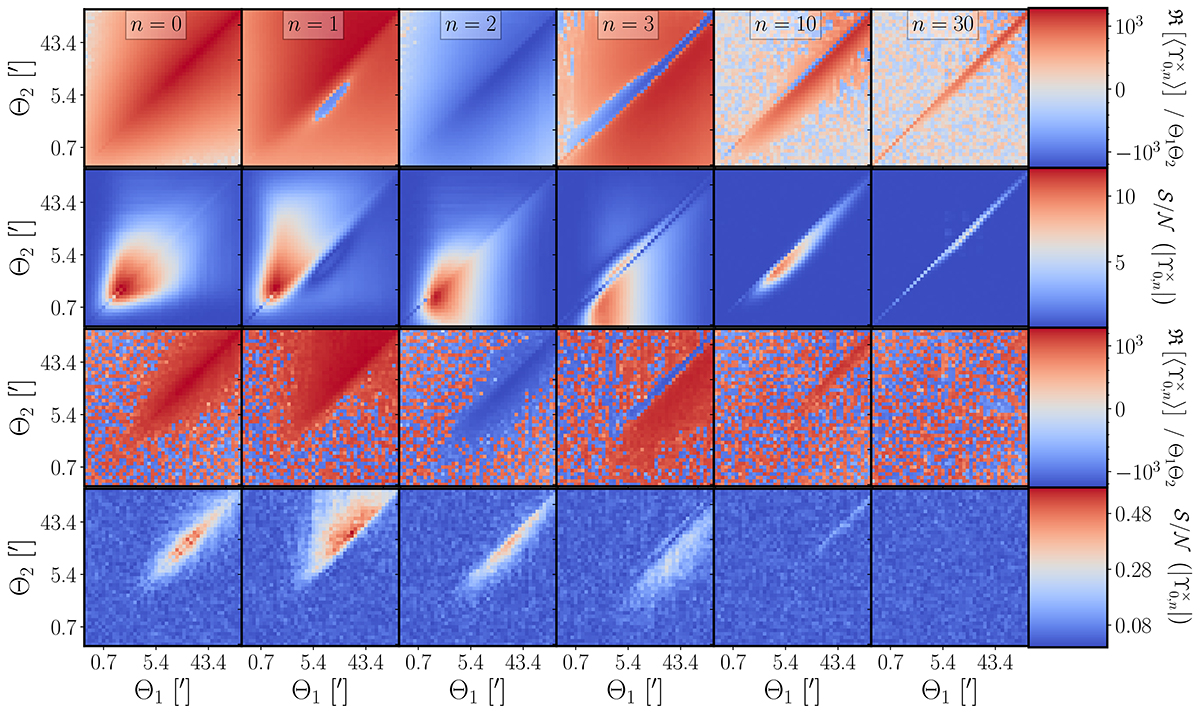
Mean signal and detectability of the higher-order multipoles, Υ0, n×, in the SLICS ensemble, after averaging over all 819 realizations. In the top row, we show the mean signal from the noiseless SLICS ensemble. To aid the visualization, we normalize the multipoles by the product of the corresponding angular bins and further use a logarithmic scaling for positive and negative values in the color map. In the second row, we show the S/N ratio of the modulus of the corresponding multipole component. The third and fourth rows display the same measurements when shape noise is included in the mocks.
Current usage metrics show cumulative count of Article Views (full-text article views including HTML views, PDF and ePub downloads, according to the available data) and Abstracts Views on Vision4Press platform.
Data correspond to usage on the plateform after 2015. The current usage metrics is available 48-96 hours after online publication and is updated daily on week days.
Initial download of the metrics may take a while.