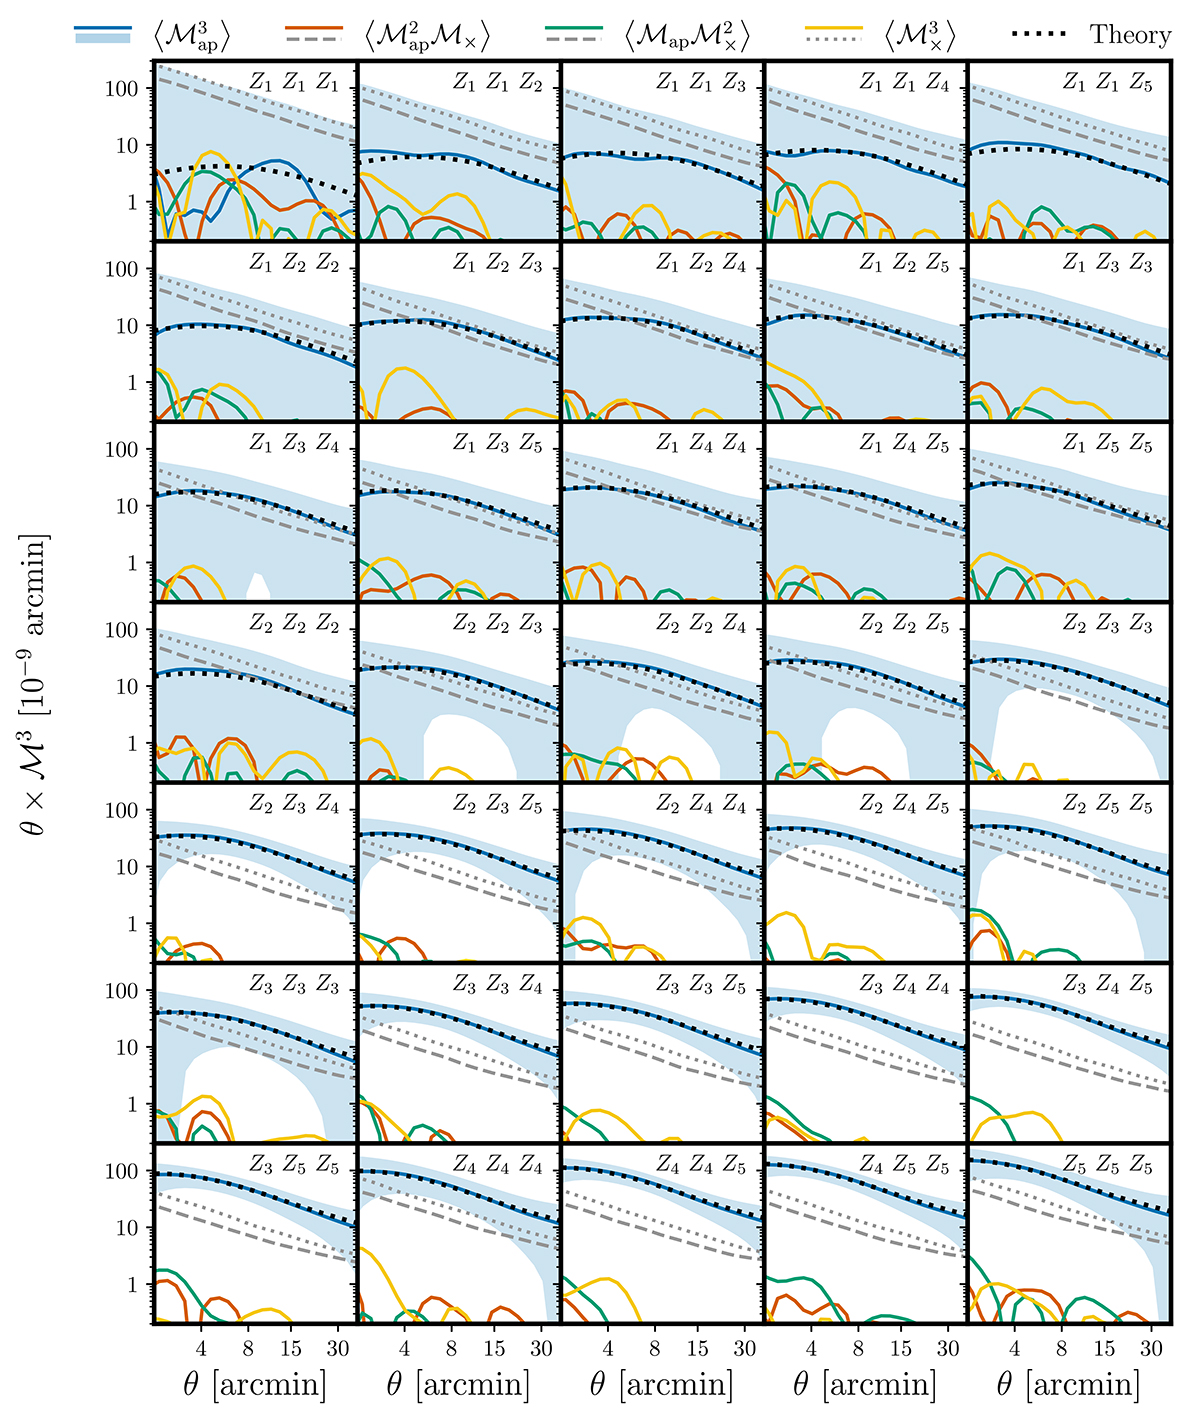
Fig. E.1.
Download original image
Tomographic third-order aperture mass statistics in the T17 ensemble. In each panel, we show the measured statistic for one configuration of the tomographic bins. The mean ℳap3 signal and its standard deviation are plotted as the solid blue line and the blue error band. The other solid lines indicate the absolute values of the remaining third-order measures and the 1σ uncertainty level of those measures are indicated by the dashed gray (dotted) lines. The theoretical prediction is shown as the dotted black line.
Current usage metrics show cumulative count of Article Views (full-text article views including HTML views, PDF and ePub downloads, according to the available data) and Abstracts Views on Vision4Press platform.
Data correspond to usage on the plateform after 2015. The current usage metrics is available 48-96 hours after online publication and is updated daily on week days.
Initial download of the metrics may take a while.