Fig. 9.
Download original image
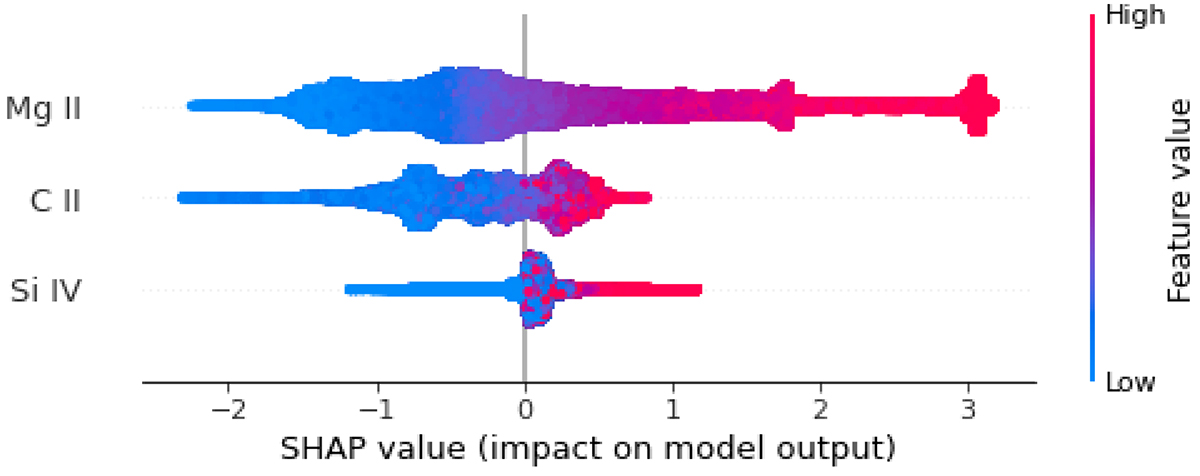
Example plot presenting the ranked importance of each spectral line in terms of Shapley values. The y-axis gives the ranking of the spectral lines: Mg II h&k is ranked highest, followed by C II and Si IV ranked the lowest. The width of the horizontal features is proportional to the number of occurrences, for example, most Shapley values for Si IV were between zero and 0.2. The range of the Shapley values was largest for Mg II, which is visible as the extent of the x-axis. The colour indicates the magnitude of the network outputs of the models, while the Shapley values indicate the direct impact on the XGBoost model output. The colour corresponds to the ![]() model output from each spectral line.
model output from each spectral line.
Current usage metrics show cumulative count of Article Views (full-text article views including HTML views, PDF and ePub downloads, according to the available data) and Abstracts Views on Vision4Press platform.
Data correspond to usage on the plateform after 2015. The current usage metrics is available 48-96 hours after online publication and is updated daily on week days.
Initial download of the metrics may take a while.