Open Access
Fig. 2.
Download original image
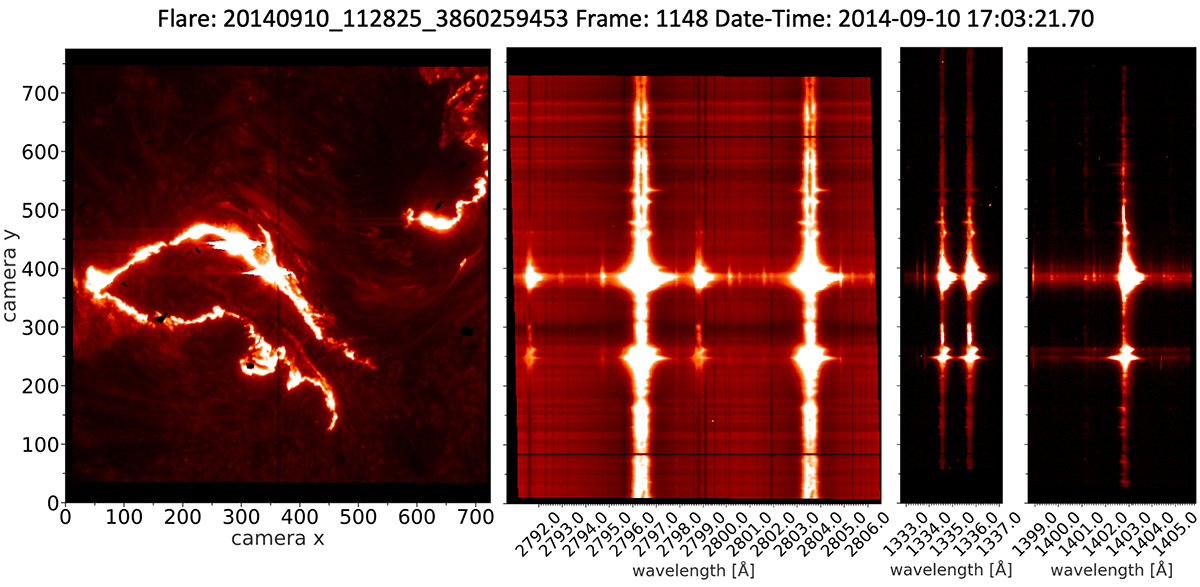
Example of IRIS spectra used for this study, showing the three considered spectral lines Mg II, C II, and Si IV. The IRIS spectrograph slit is visible as a vertical black line in the flare image at location x ∼ 370.
Current usage metrics show cumulative count of Article Views (full-text article views including HTML views, PDF and ePub downloads, according to the available data) and Abstracts Views on Vision4Press platform.
Data correspond to usage on the plateform after 2015. The current usage metrics is available 48-96 hours after online publication and is updated daily on week days.
Initial download of the metrics may take a while.