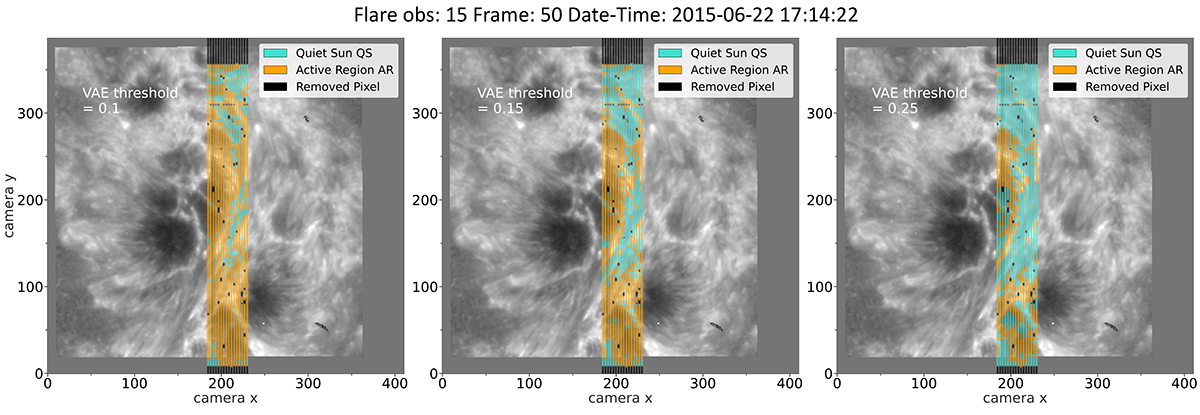
Fig. A.2.
Download original image
Comparison of three different reconstruction thresholds for a single observation, overlaid on the Mg II slit-jaw image. The light blue pixels are the spectra reconstructed with an error lower than the chosen reconstruction threshold. The pixels in orange are the spectra reconstructed with an error above the threshold. In the left panel a too low threshold was selected, most pixels are kept. The right panel shows how only areas around the bright ribbon like structure are selected and in the centre panel the bright structure and some areas extending around it are kept.
Current usage metrics show cumulative count of Article Views (full-text article views including HTML views, PDF and ePub downloads, according to the available data) and Abstracts Views on Vision4Press platform.
Data correspond to usage on the plateform after 2015. The current usage metrics is available 48-96 hours after online publication and is updated daily on week days.
Initial download of the metrics may take a while.