Open Access
Fig. 10.
Download original image
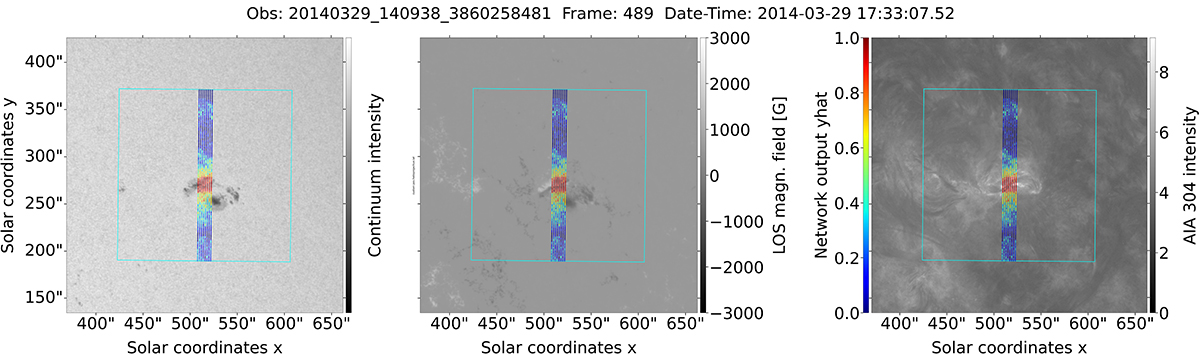
PF-observation number two, which resulted in an X1.0 flare. The active region is limited to a small area of the IRIS spectrograph slit. The models flag the area above the polarity inversion line as most important.
Current usage metrics show cumulative count of Article Views (full-text article views including HTML views, PDF and ePub downloads, according to the available data) and Abstracts Views on Vision4Press platform.
Data correspond to usage on the plateform after 2015. The current usage metrics is available 48-96 hours after online publication and is updated daily on week days.
Initial download of the metrics may take a while.