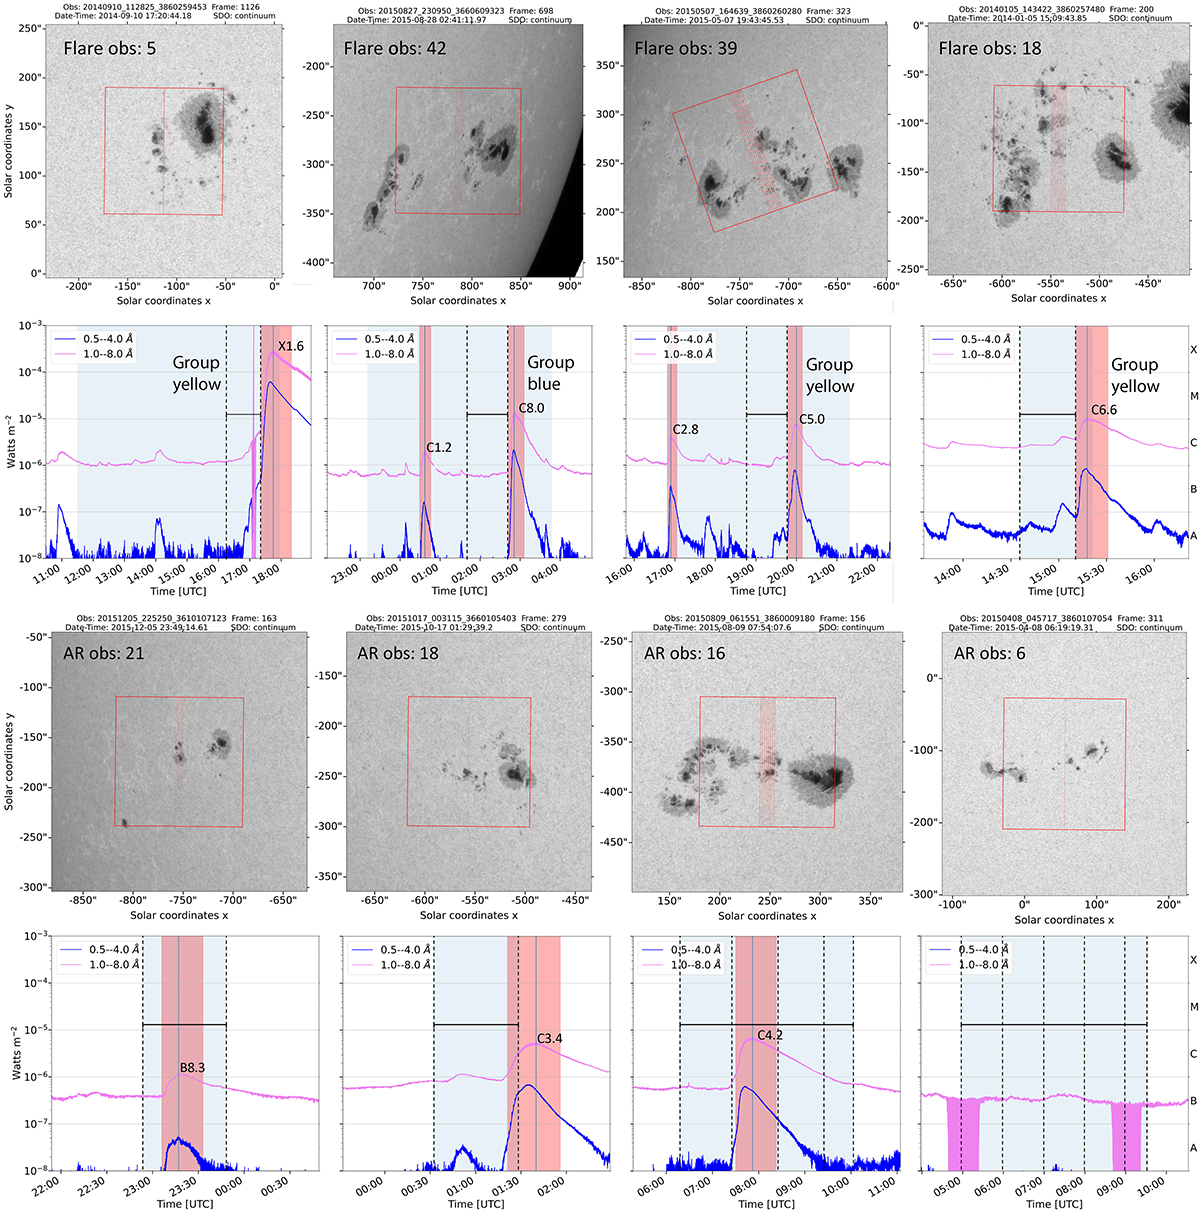
Fig. 1.
Download original image
Examples of observations of active regions with IRIS in the continuum channel of HMI, the recalibrated GOES X-ray flux for the time period of the observation, and the flare class from the HEK database. The red frame with the vertical lines displays the FOV and the slit positions of the IRIS spectrograph. In the GOES X-ray flux we show the time window of the IRIS observation as a light blue shaded region. The red shaded region with the vertical line depicts the time of a flare, from beginning to end, according to the HEK database. The black dashed vertical and horizontal line depict the parts that were cut from the observations and used for training and testing the classification models.
Current usage metrics show cumulative count of Article Views (full-text article views including HTML views, PDF and ePub downloads, according to the available data) and Abstracts Views on Vision4Press platform.
Data correspond to usage on the plateform after 2015. The current usage metrics is available 48-96 hours after online publication and is updated daily on week days.
Initial download of the metrics may take a while.