Fig. 4.
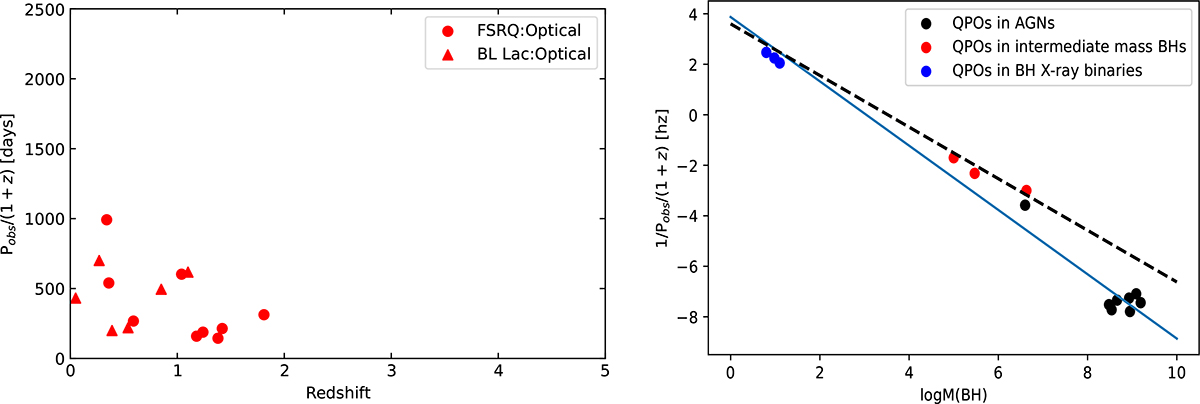
Download original image
Correlation between the period and the redshift (left panel) as well as the correlation between the period and the supermassive black holes mass (right panel). In the left panel, the red dots represent the FSRQs and red triangles represent the BL Lacs. In the right panel the black dots represent the QPOs in AGNs, the red dots represent the QPOs in intermediate-mass BHs, and the blue dots represent the QPOs in BH X-ray binaries. The gray dash line is given in Abramowicz et al. (2004), the slope of which is −1, while the blue solid line with a slope of −1.27 is the linear fitting result of all points.
Current usage metrics show cumulative count of Article Views (full-text article views including HTML views, PDF and ePub downloads, according to the available data) and Abstracts Views on Vision4Press platform.
Data correspond to usage on the plateform after 2015. The current usage metrics is available 48-96 hours after online publication and is updated daily on week days.
Initial download of the metrics may take a while.