Open Access
Fig. 6
Download original image
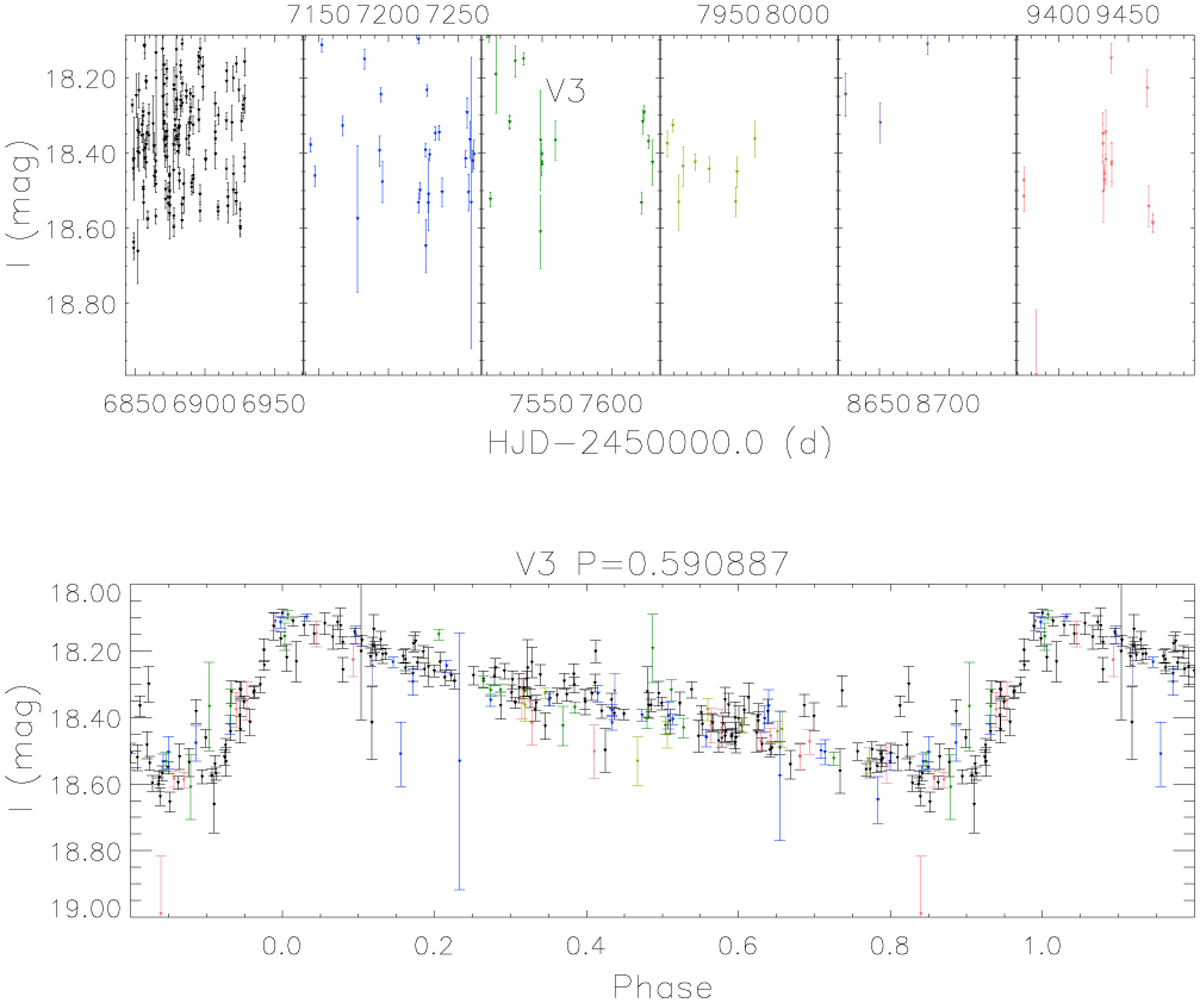
Variable star V3. The top plot shows the light curve in I magnitude versus HJD while the bottom plot shows the I magnitude versus the phase obtained with a period of 0.590887 d. The colors of the plots match those in Fig. 1.
Current usage metrics show cumulative count of Article Views (full-text article views including HTML views, PDF and ePub downloads, according to the available data) and Abstracts Views on Vision4Press platform.
Data correspond to usage on the plateform after 2015. The current usage metrics is available 48-96 hours after online publication and is updated daily on week days.
Initial download of the metrics may take a while.