Fig. A.3
Download original image
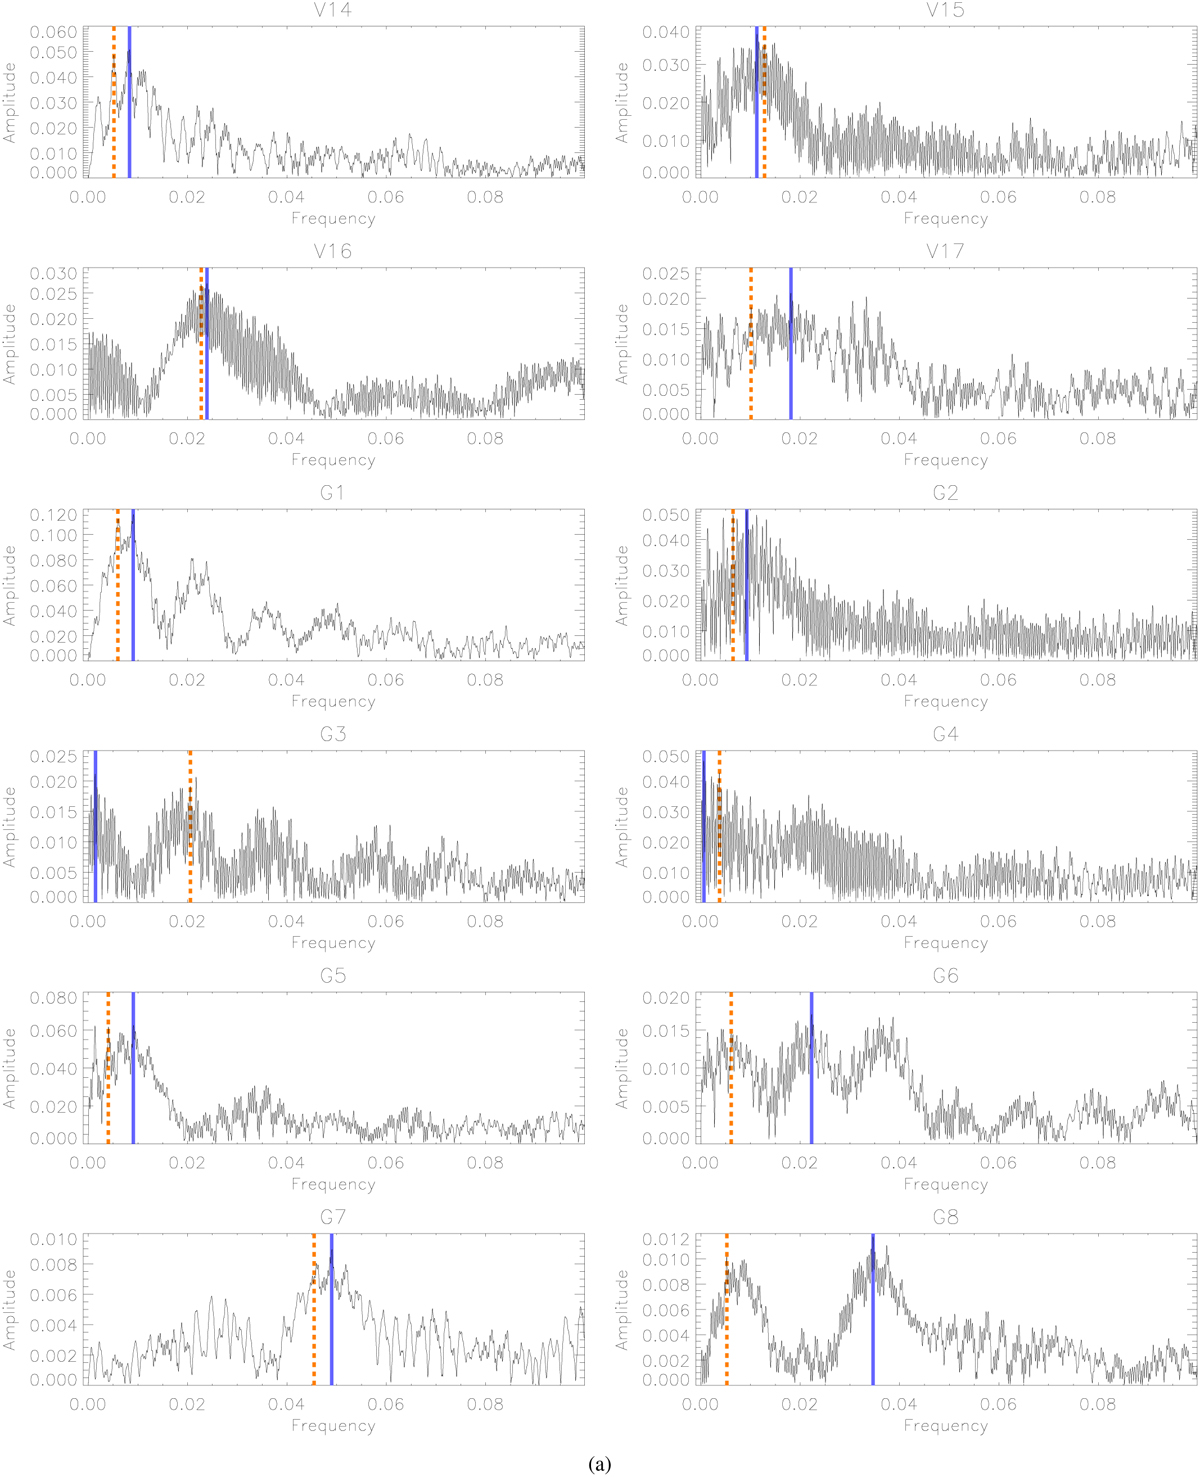
Periodograms for all stars classified as semiregular in this study, including the newly discovered variables (V14-V17) and earlier stars flagged as variables in Gaia (G1-G9). The vertical solid purple line represents the strongest frequency found in the periodogram using the least square technique, while the dashed orange line represents the frequency found using the fast χ2 method.
Current usage metrics show cumulative count of Article Views (full-text article views including HTML views, PDF and ePub downloads, according to the available data) and Abstracts Views on Vision4Press platform.
Data correspond to usage on the plateform after 2015. The current usage metrics is available 48-96 hours after online publication and is updated daily on week days.
Initial download of the metrics may take a while.