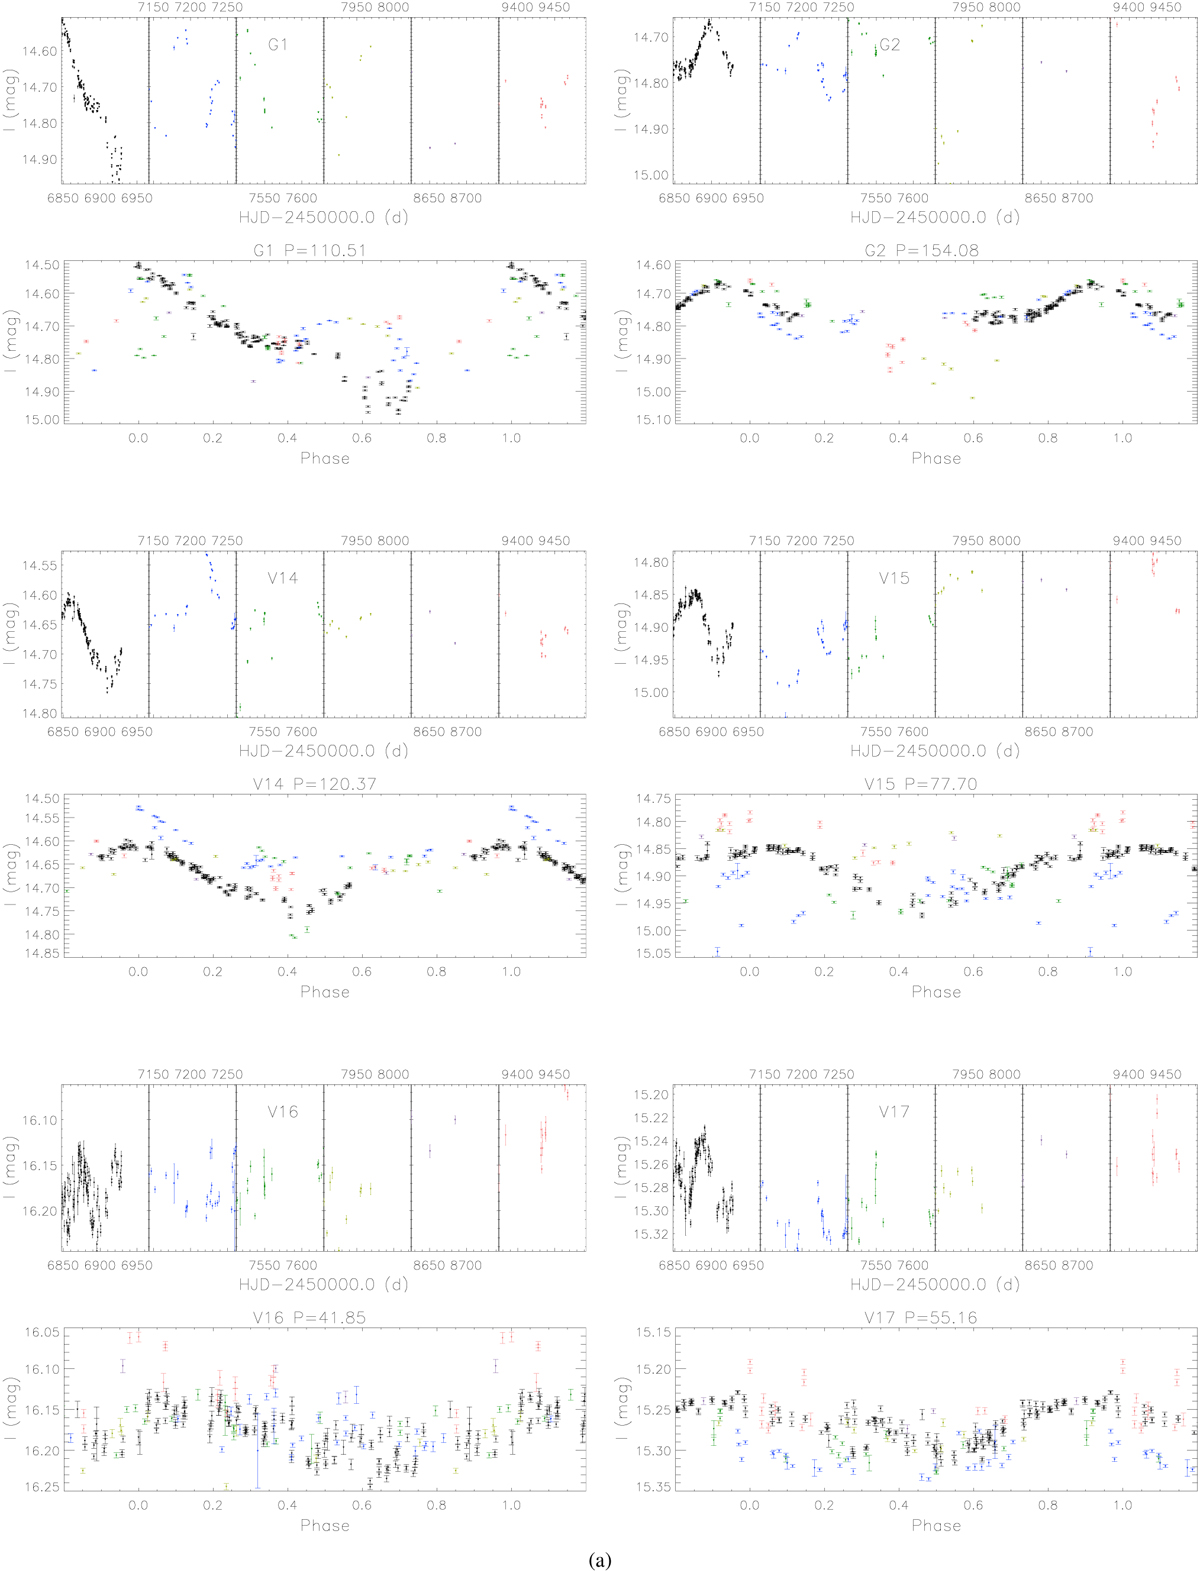
Fig. A.1
Download original image
Light curves of newly discovered variables V14-V17 in the GC Terzan 5, as well as variables classified as semiregular. The top plot shows the I-band light curves with time in units of HJD, while the bottom plot displays the phased light curves with periods and epochs listed in Table A.1. The colors of the plots match those in Fig. 1.
Current usage metrics show cumulative count of Article Views (full-text article views including HTML views, PDF and ePub downloads, according to the available data) and Abstracts Views on Vision4Press platform.
Data correspond to usage on the plateform after 2015. The current usage metrics is available 48-96 hours after online publication and is updated daily on week days.
Initial download of the metrics may take a while.