Fig. 13
Download original image
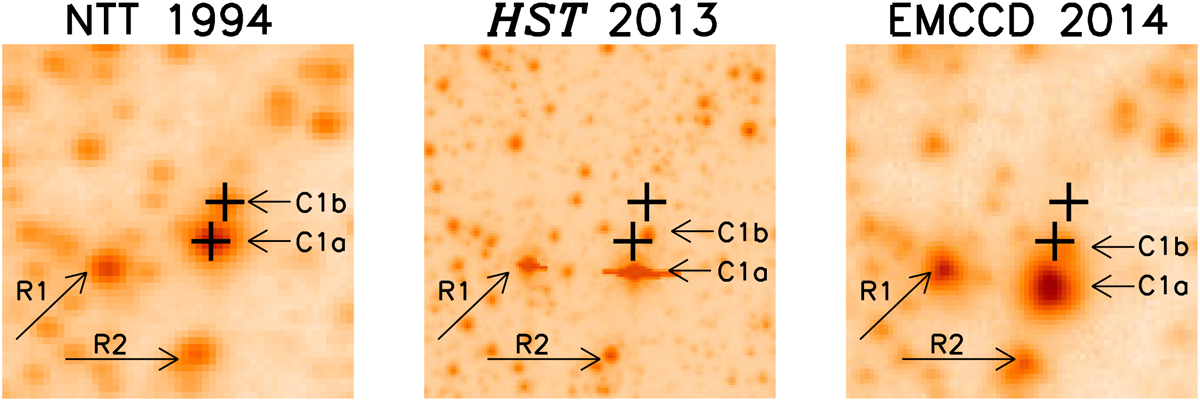
Comparison of the positions of C1a and C1b in a section of the NTT image from 1994 (on the left) with the positions in the HST image taken in 2013 (in the middle), and the EMCCD image taken in 2014 (on the right). The crosses represent the star’s positions measured in the NTT image. The stars labeled R1 and R2 are for comparison. The size of the images is about 7″. The color scale is not exactly the same in the three plots. North is up and east is left.
Current usage metrics show cumulative count of Article Views (full-text article views including HTML views, PDF and ePub downloads, according to the available data) and Abstracts Views on Vision4Press platform.
Data correspond to usage on the plateform after 2015. The current usage metrics is available 48-96 hours after online publication and is updated daily on week days.
Initial download of the metrics may take a while.