Fig. 10
Download original image
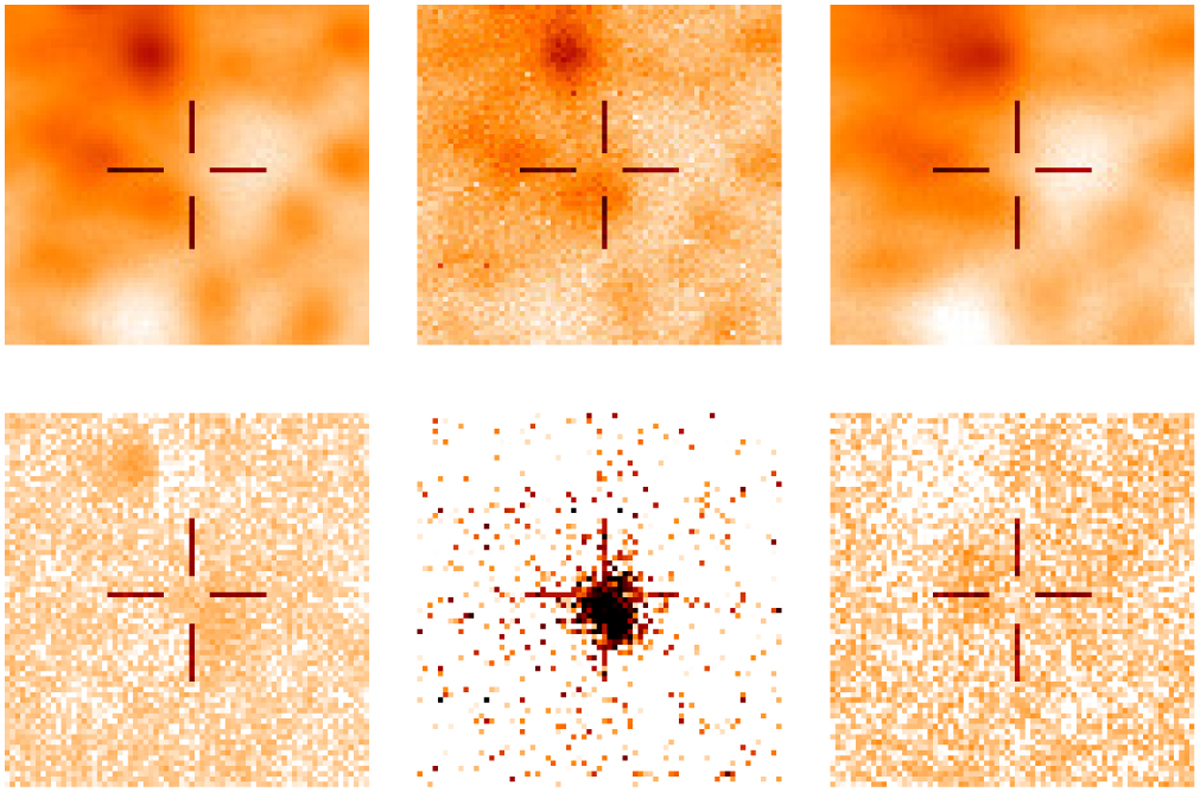
Zoom onto the signal found at the position of the visual detection N1. The top boxes show the last image taken before the detection (left), the image containing the detection (middle), and the image taken after the registered detection (right), while the bottom boxes correspond to the difference images obtained by subtracting the reference frame from each of the science images shown at the top. Each box is about 6″ × 6″ in size, and the color scale is logarithmic.
Current usage metrics show cumulative count of Article Views (full-text article views including HTML views, PDF and ePub downloads, according to the available data) and Abstracts Views on Vision4Press platform.
Data correspond to usage on the plateform after 2015. The current usage metrics is available 48-96 hours after online publication and is updated daily on week days.
Initial download of the metrics may take a while.