Fig. 4
Download original image
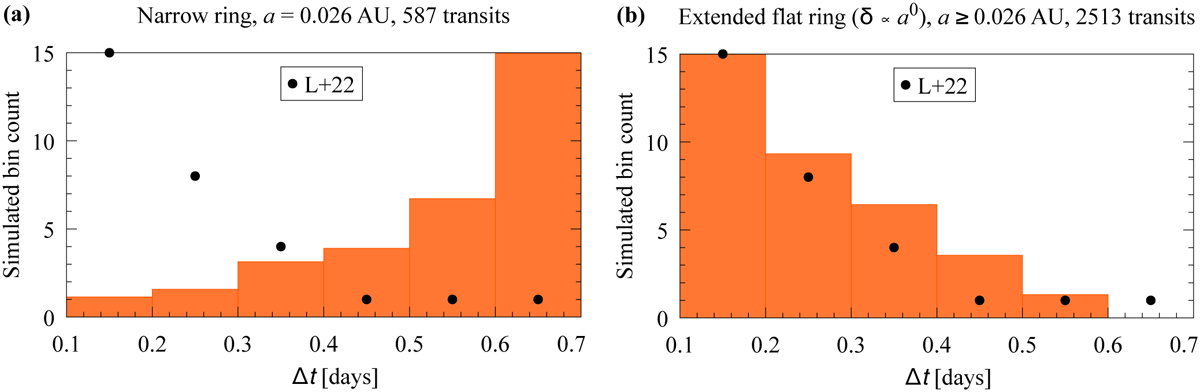
Histogram of the transit durations (Eq. (5)) based on 300 000 randomly chosen orbital orientations of an exocometary sample. The black dots illustrate the bin counts compiled from L+22. (a) Orbital distance fixed to 2.5 AU around β Pic. (b) Orbital distance drawn from a flat distribution with 0.026 AU ≤ a ≤ 2.5 AU around β Pic. The histograms are normalized to 15, corresponding to Fig. 2.
Current usage metrics show cumulative count of Article Views (full-text article views including HTML views, PDF and ePub downloads, according to the available data) and Abstracts Views on Vision4Press platform.
Data correspond to usage on the plateform after 2015. The current usage metrics is available 48-96 hours after online publication and is updated daily on week days.
Initial download of the metrics may take a while.