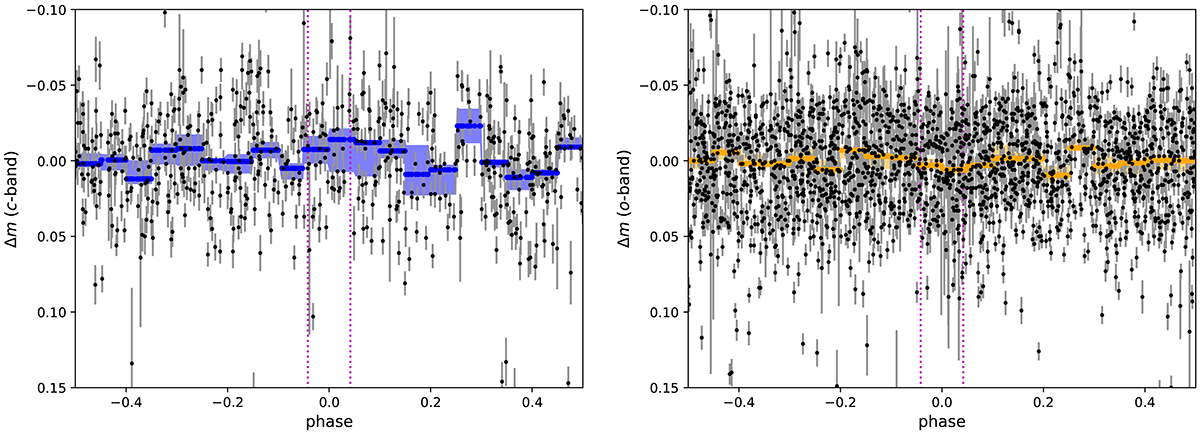
Fig. B.3.
Download original image
Phased light curves of K2-22 from forced photometry in ATLAS images through “cyan" (left) and “orange" (right) filters. The curves are the medians in 20 bins and the shaded regions are the 68% confidence range based on 1000 samples with replacement. The vertical dotted lines are the predicted phases of ingress and egress based on a 46-min transit duration (Sanchis-Ojeda et al. 2015).
Current usage metrics show cumulative count of Article Views (full-text article views including HTML views, PDF and ePub downloads, according to the available data) and Abstracts Views on Vision4Press platform.
Data correspond to usage on the plateform after 2015. The current usage metrics is available 48-96 hours after online publication and is updated daily on week days.
Initial download of the metrics may take a while.