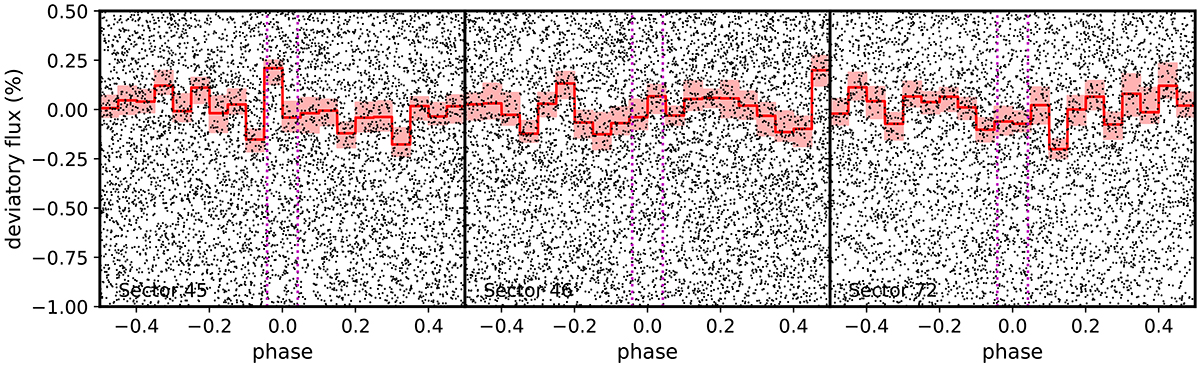
Fig. B.2.
Download original image
TESS light curves of K2-22 for Sectors 45, 46, and 72 phased to the orbital period of “b". The red curve is the median in 20 bins and the shaded region is the 68% confidence range based on 1000 re-samples with replacement. The vertical dotted lines are the predicted phases of ingress and egress based on a 46-min transit duration (Sanchis-Ojeda et al. 2015). Many individual data points outside the range are not shown.
Current usage metrics show cumulative count of Article Views (full-text article views including HTML views, PDF and ePub downloads, according to the available data) and Abstracts Views on Vision4Press platform.
Data correspond to usage on the plateform after 2015. The current usage metrics is available 48-96 hours after online publication and is updated daily on week days.
Initial download of the metrics may take a while.